
Plotting structural geology data in ArcGIS
Update: I suggest using ArcGIS Pro instead of ArcMap – if you need help with this let me know.
—
This tutorial covers plotting structural geology data in ArcGIS. In this tutorial I am going to use the example of plotting foliation data, but this is applicable to any data where a rotated symbol is required.
Reducing the file size of reports, theses and other written documents (compressing)
This page covers reducing the file size of reports, theses and other written documents (compressing). Figures/images are the main contributor to large file sizes for documents. I show you how to deal with figures/images as you make them. I also show you how to compress the images in the document when you have finished writing. Continue reading
Preparing illustrations for use in theses, reports and publications
Considerations
What software are you making your thesis in? The two main ones are ms word and latex. Please note that due to the variation in versions of ms-word on pc and mac, it is difficult to write consistent instructions for it.
Create a figure template
Figure Width: make your figures so that they are always the width of the page minus the margins (see figure below). For publications you will have a template for one or two columns.
Figure Length:Make your figure length to suit the figure up to a maximum that leaves room for the caption to appear on the same page (see figure below).

Figure template guide.
Why not just scale each figure as necessary to fit in the word doc or LaTeX?
There are various reasons why using a template is the best approach:
- Image sizes won’t get bloated. You can set resolution of output (e.g. 300ppi) and know that the image will be 300ppi.
- Font size, stroke width etc. will be consistent
- Easier to make figures.
File formats
MS-word
For ms-word use EMF format to get vector graphics. Or use PNG/JPEG depending on whether the format is graphics like or photo like (refer to the poster in the graphics lab for this).
LaTeX
Best to just use PDF format. Occasionally there are issues with transparency, gradients and nested hidden objects.
Journals
Journals are sometimes restrictive in what format they accept. They usually focus on people submitting a particular file format at a particular resolution rather than assessing the quality (e.g. optical resolution of rasters) or file size issues. Ideally you would just submit PDF for vector figures. Sometimes they won’t accept PDF but will accept EPS which is a similar format. For rasters they tend to prefer .tiff at 600ppi or 1200ppi, even though PNG is much better at lossless compression of some rasters.
Techniques using Adobe illustrator
Make sure you check the use artboards thing on export. Refer to this post on pdf linking embedding and saving in illustrator
You might also find the post on optimising pdfs in acrobat pro useful.
Optimising PDFs in acrobat pro (including downsampling and compressing rasters)
Sometimes we are required to reduce the file size of a pdf so that it can be uploaded, emailed etc. When we are printing something we always want to use an uncompressed version though.
Some concepts
There are a couple of key concepts that are useful to understand when reducing the file size of a pdf. Usually vector text graphics etc. take up a small proportion of the pdf file size and the thing that makes pdfs large are embedded rasters (aka bitmaps, images) such as photos. To make these rasters smaller we can do two things to them.
1 Downsampling
This is the process of reducing the number of pixels in an image. Typically downsampling will be achieved by choosing a lower pixel density (PPI) such as 150ppi rather than 300ppi. This will result in a squared reduction in file size. For example if you downsample from 300 to 100ppi the new file will be ¼ the size of the original. You might choose to downsample an image if you don’t expect someone to view it at a high pixel density (i.e. for images that will only be viewed on screen).
2 Raster compression
This is the process of storing the information about an image more efficiently. Compression falls into two categories: lossy and lossless and there are a variety of file types that utilize different compression algorithms. Jpeg compression is lossy and stores information about how the colours change from one corner of an 8×8 pixel square to the other corner (if you look closely at highly compressed JPEGs you can see this effect . Sometimes compression is used generally to refer to any kind of activity that will reduce the file size, I will use raster compression to explicitly refer to the compression to a raster image not including downsampling.
More concepts
For a bit of background check out the blog post I did about pixel count resolution etc.
The quick and dirty method: saving as reduced size pdf from acrobat pro
This is a bit of a mystery approach. I’ve looked into it and I cannot figure out what this actually does to the rasters. Sometimes this works ok. This is the quick and dirty approach.
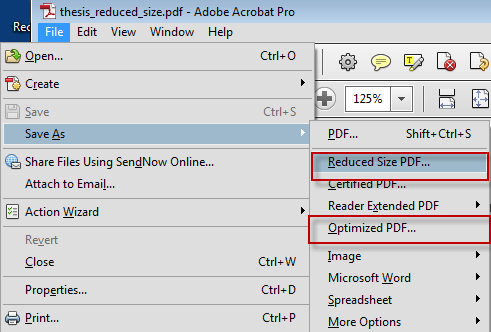
Save as options from Acrobat pro
The better approach: save as optimising pdf
Saving as optimised pdf gives you a lot more options including the ability to see what is taking up space in your pdf (Click on Save as> Optimized PDF>Audit space usage).
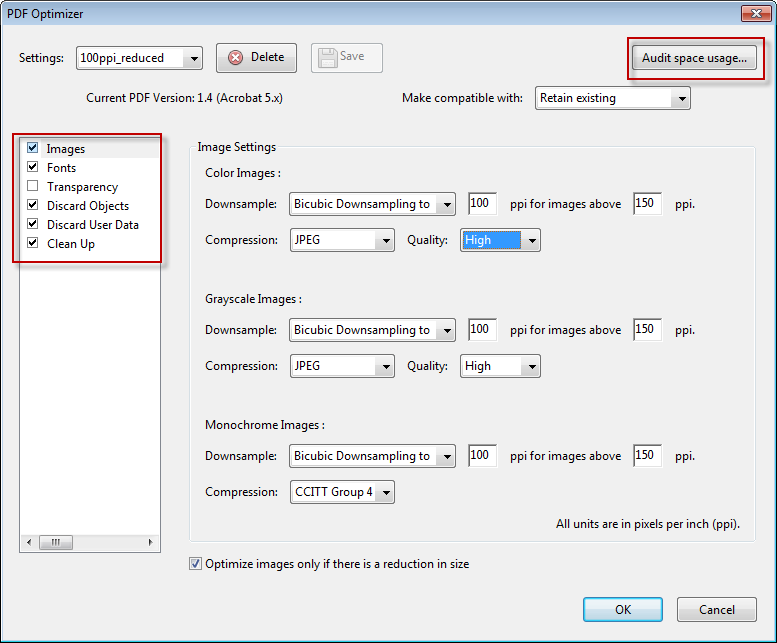
Pdf optimiser options. Each of the boxes on the left hand side are submenus.
Clicking on audit space usage will bring up a box listing the size and percentage for each element in your pdf. In the example below there are three main contributors to the large file size:
- Images
- X-object Forms: the vector graphics in the document
- Piece information: In the case of this document this turns out to be information created by the program that made the pdf (LaTeX) and we don’t actually need it.
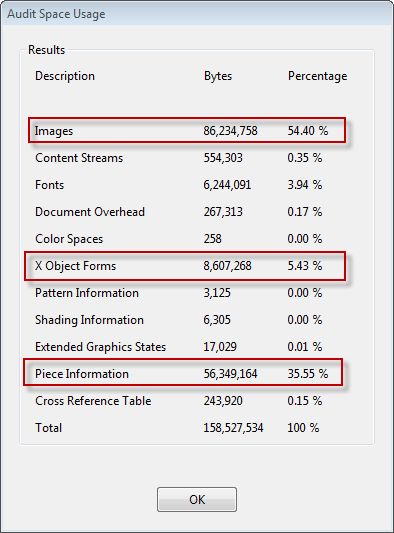
Audit space usage dialog box
We can do stuff to make 1 and 3 Smaller but there’s not much we can do about 2 (in some rare cases rasterising the really complex vector graphics may help).
Other optimising things
Before we start downsampling and compressing the images it’s useful to look at what can be done to the rest of the pdf. I found this useful information out from http://chris-hummersone.blogspot.co.nz/2011/01/how-to-reduce-size-of-your-document.html . Chris’s post deals specifically with pdfs created from LaTex but the principles should be transferable to any pdf.
Below are the settings he recommends for each tab (for more detail read his post).
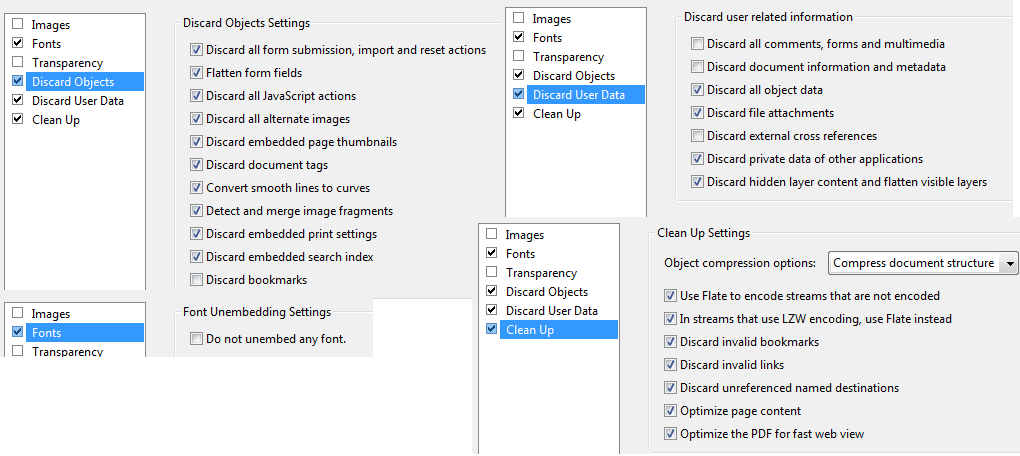
Recommended options for PDF optimising
I recommend saving these settings so you can use them again. In the example above where piece information contributed ~50MB the file size was reduce by approximately 50MB.
Image downsampling and raster compression
The amount of downsampling and raster compression that you choose to use is going to depend on the purpose for the document. The lower limit I would go to is bicubic downsampling to 100ppi for all image types and JPEG at high quality. This should produce a much smaller pdf for viewing on a computer (e.g. 20MB vs. 150MB). You may want to save various configurations for downsampling and compressing that are fit for different purposes.
Do not do any compression to the version you want to print. Print is much higher resolution than on screen and any compression is much more noticeable.
Some notes on saving PDFs with illustrator compatibility and/or embedded images.
I’m not entirely sure if optimising a pdf will get rid of extra images that are stored when pdfs are saved from illustrator with ai compatibility checked and embedded images. See my previous post for information about best saving practices from AI.
