
Focus stacking images using macro or stereomicro photography equipment and Zerene stacker
This article has been specifically written for using the macro-photography setup or the stereomicroscope setup in the Imaging Lab (formerly called the Graphics Lab) in the geology department. Instructions are for using Zerene stacker to stack the images rather than photoshop because it is faster, easier and produces better results in all cases that I have seen. For example Zerene Stacker took 72s to stack 11 images and photoshop took 125s, the difference in stacking speed is even more pronounced when more images are used.
This post supersedes the previous focus stacking post I wrote which recommended using photoshop.
Focus stacking images
This article has been specifically written for using the macro-photography setup in the Graphics Lab in the geology department and Adobe Photoshop CS5. Concepts are applicable to other equipment and versions of Photoshop.
UPDATE:
I have made a new post with instructions using Zerene stacker to stack the images rather than photoshop because it is faster, easier and produces better results in all cases that I have seen. For example Zerene Stacker took 72s to stack 11 images and photoshop took 125s, the difference in stacking speed is even more pronounced when more images are used.
Aligning multiple images in photoshop
We want images stacked
Sometimes we capture images of the same area (e.g. a particular part of a thin section) using different conditions (reflected light, PPL, XPL, Cathodoluminescence) . We may then want to stack the images together so that we can see how each different mineral, for instance, appears under the different conditions.
THE PROBLEM
We can align objects manually because we see recognisable features in each image. It can be a little tedious and difficult trying to add, manually align, resize and rotate the images in software like: Adobe Illustrator, photoshop, the gimp, image j or other software.
There is a semi-automated way to speed up this process in photoshop. I’m not sure of the exact conditions under which this will actually work. But it’s fairly easy to try and could save you a load of time.
How to do it
The first thing we need to do is to load all the images as layers in a photoshop document.
- Open photoshop
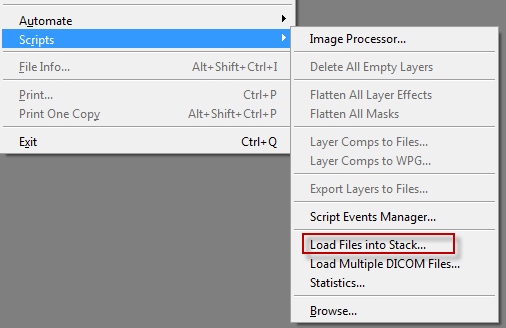
- Go to file>Scripts>Load files into Stack
- Navigate to the folder with your images in it and load these.
You should now see all your images as layers in photoshop with names corresponding to file names (handy eh?).
- Select all the layers by clicking on the top layer and then shift clicking on the bottom layer. They should all have a blue background in the layers panel indicating they are all selected.
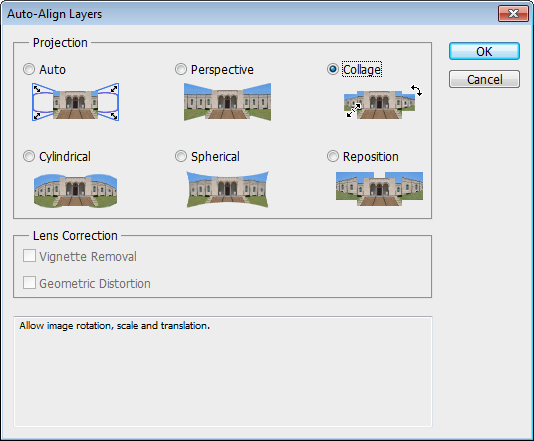
- Now go to edit>auto-align layers
- I recommend trying collage first which will not distort the image.
Thanks to Steve Kidder for working this out with me.
Dedicated cathodoluminescence microscopy (incl. image capture) setup
A few people have been using the Cathodoluminescence microscopy (incl. image capture) equipment that Brent Pooley and I set up. We have, until now, been sharing the image capture part with the photomicrograph setup in the Graphics Lab. This was quite inconvenient and it meant that the Photomicrograph setup, which gets used a lot, was often unavailable.
We are pleased to announce that we now have a dedicated Cathodoluminescence microscopy (incl. image capture) setup. This also means that the Photomicrograph setup will now have uninterrupted availability. Instructions and training are available for both setups, contact me (photomicro, CL) or Brent (CL) for training.
Pixel count, pixel density, document size, dots per inch, optical resolution
There are a lot of articles out there on the web that discuss these topics. Although understanding these concepts is inherently a little tricky, the biggest problem is the lack of consistent and unambiguous naming. In this post I will describe what these things are as unambiguously as possible. I find that sometimes its easiest to describe what you mean rather than using these names.
Definitions
Pixel count (aka pixel dimensions, resolution)
The number of pixels in an image may be reported as
- a width * height e.g. 1024*768pixels
- a total number of pixels e.g. for cameras: 2450*3700 = 9065000 Pixels = ~9 Megapixels
Pixel density (aka: digital resolution, resolution)
Often incorrectly referred to as dots per inch (see description for DPI below)
A measure of the density of the pixels in physical space. For example how many pixels in one linear inch (PPI).
This may be reported for screens; for example a 1920*1080 monitor that is 26.7inches across will have a pixel density (resolution) of 1920/26.7 = 72ppi. Note that most monitors with this pixel count are smaller (maybe 23inches) and thus have a pixel density (resolution) higher than 72ppi.
Raster images (e.g. photos) also have a value stored for pixel density (resolution). By default most cameras will set this value to 72ppi.
If you are scanning something than you may choose a resolution for scanning such as 300ppi for documents and 1000ppi for slides. In this case it is most likely that the value stored in the file will be this value.
Document size (aka: image size, presented size)
Not to be confused with image file size (aka: image size) which is the size of the image file i.e. 2.5MB.
Document size is the physical dimensions that an image has (perhaps measured in cm or mm). This is easier to get your head around for printed material where we can just get out a ruler to measure the image size.
For raster images (e.g. photos) on a computer the document size is actually just whatever is calculated using the pixel count and the pixel density.
pixel density = pixel count (in one direction)/ image size (in one direction)
For example if an image is 2400pixels across and has a pixel density of 300ppi than the document size will be 2400/300 = 8 inches = 203.2mm, that’s slightly less than the width of an A4 page.
Dots per inch (aka: printed resolution, dot density)
Printers have limited colours (usually just cyan, magenta, yellow and black). In order to create all the colours and tones for a photo these colours are printed in variable amounts as a dot pattern. If you look closely at a printed page or use a magnifying glass you can see this dot pattern.
The higher the number of dots per inch there is in a printed image the greater the level of detail typically. More dots are required than the pixel count to get the same detail as an image on a screen. Printers will typically print at 300dpi, 720dpi or higher.
Dots per inch is commonly used interchangeably with pixels per inch. This is wrong. Pixels per inch is the correct term for pixel density on a computer and dots per inch is the correct term for printed images.
An image with pixels, shown on left compared to the same image with dots shown on the right
Optical resolution
Optical resolution is a measure of the ability to resolve detail in an image. A simple way to measure this is to imagine the smallest and closest possible objects that can be resolved as two distinct objects.
This is perhaps the least considered aspect of images and image capture (e.g. photography, scanning) and one of the most important. Optical resolution, is perhaps the only true resolution.
While the pixel count sets an upper limit for optical resolution it is generally the optics of the image capture system and in the case of photography the quality of the camera and skill of the photographer that determine the optical resolution.
To understand how pixel count is different to optical resolution let us consider two examples:
- If an image is out of focus then it will have a lower optical resolution than an image in focus that is captured using the same pixel density.
- A slide scanner can capture at 1200ppi, 2400ppi or 4800ppi, however due to the optical resolution limit of the scanner there may be no difference in optical resolution at 4800ppi vs 2400ppi. At 1200ppi the optical resolution of the image captured is lower than at 2400ppi because the pixel density is now the determining factor. See image below.
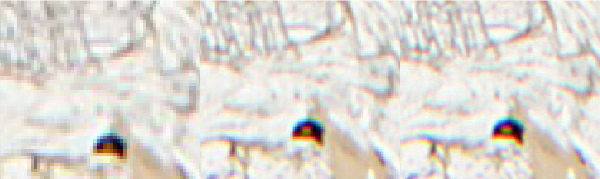
Thin sections scanned at 1200ppi (left), 2400ppi (middle) and 4800ppi(right)
