
Introduction to 3D diagrams
How to make good diagrams (general principles)
Before we go into making 3D diagrams it’s a good idea to think about what makes a good diagram in the first place. A good diagram satisfies these conditions:
- It is useful. It helps to explain something that cannot be described easily using text alone.
- It doesn’t try to explain too many things at once.
- The diagram communicates the idea as effectively as possible
- The diagram uses a good provision of detail: extraneous details are left out so that the diagram is not overly complex
- The diagram focuses attention on the key features that are important
- It is visually appealing
See also: Science illustration tutorials
Concept stage (Sketch by hand first!)
The first question you should ask yourself is “does this need to be a 3D diagram?”. 2D diagrams require less work and are usually easier to interpret. Are you making a 3D model of geology where a cross section or map would suffice?
One of the first keys to 3D diagrams (and other diagrams) is to sketch your concepts out first. Often we have ideas in our head of how a diagram could work, but they don’t really work on paper (or on a computer). It’s better to find this out by doing a few quick sketches rather than hours on a computer!
How to create 3D effects
When we are presenting 3D models we are usually presenting them in 2D on a screen or in print (although we can make fully 3D interactive diagrams). So we need to use certain visual cues to create the 3D effect.
Most 3D diagrams consist of a series of objects drawn as if you were viewing them from an angle. For most objects we want to be looking down and not aligned with any of the sides of the object.
Q: Which of the objects below looks most 3D?
A:
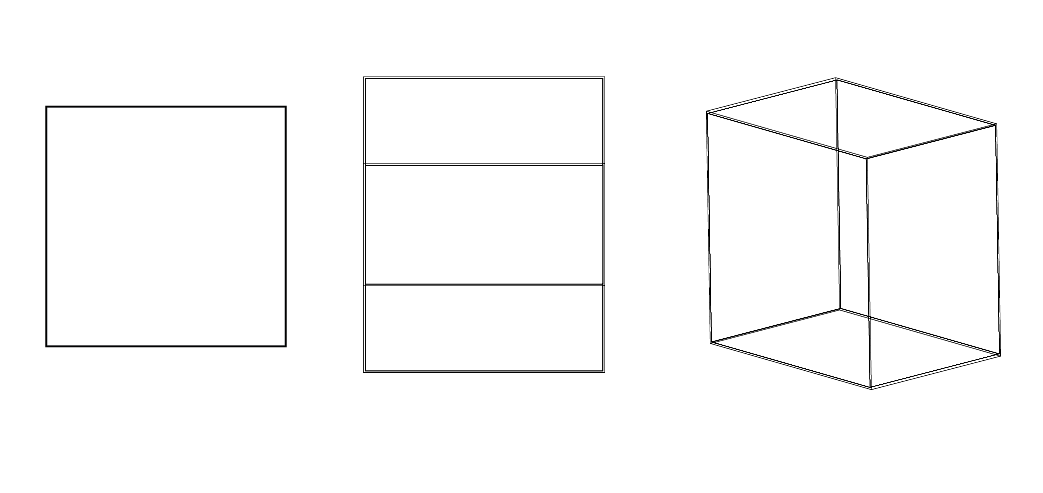
A common technique for geology diagrams is to draw the figure within a 3D rectangle or cube (rectangular prism) often these are called “block models” (not to be confused with 3D models consisting of unit cell blocks). Where the edges of geology meet the walls of the model we are essentially drawing cross sections. 3D cut-aways can be used to further enhance the 3D effect.
There are other cues we can use to enhance the 3D effect such as:
- Using perspective. Having lines converge to a vanishing point. Drawing objects further away smaller. But often we don’t want to use this cue (see section on ortho vs. perspective).
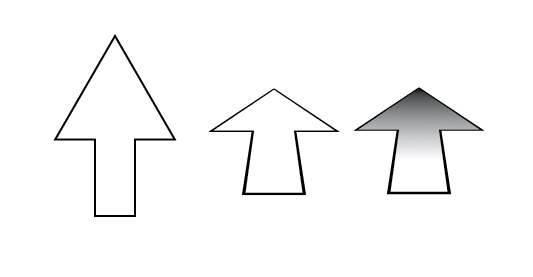
- Dark to light. DEMs are usually shaded this way. Look at the arrows below, which looks the most 3D?
- Shading, shadows and light source. Typically lighting from the top left.
- Atmospheric perspective. Light that passes through more atmosphere will be more washed out with a blueish-reddish tinge to it. So we can add this to diagrams as a cue.
These cues are used to enhance the 3D effect, but there are other methods we can use to make the vitalisation and interpretation of a 3D diagram easier for the viewer.
Ortho versus perspective
In perspective view parallel lines drawn oblique to our view converge at a vanishing point and objects further way appear smaller. This is how we view the world. In orthographic view parallel lines never converge and identical objects are the same size regardless of where in the viewport they are drawn. It’s essentially like being at an infinite distance from the object.
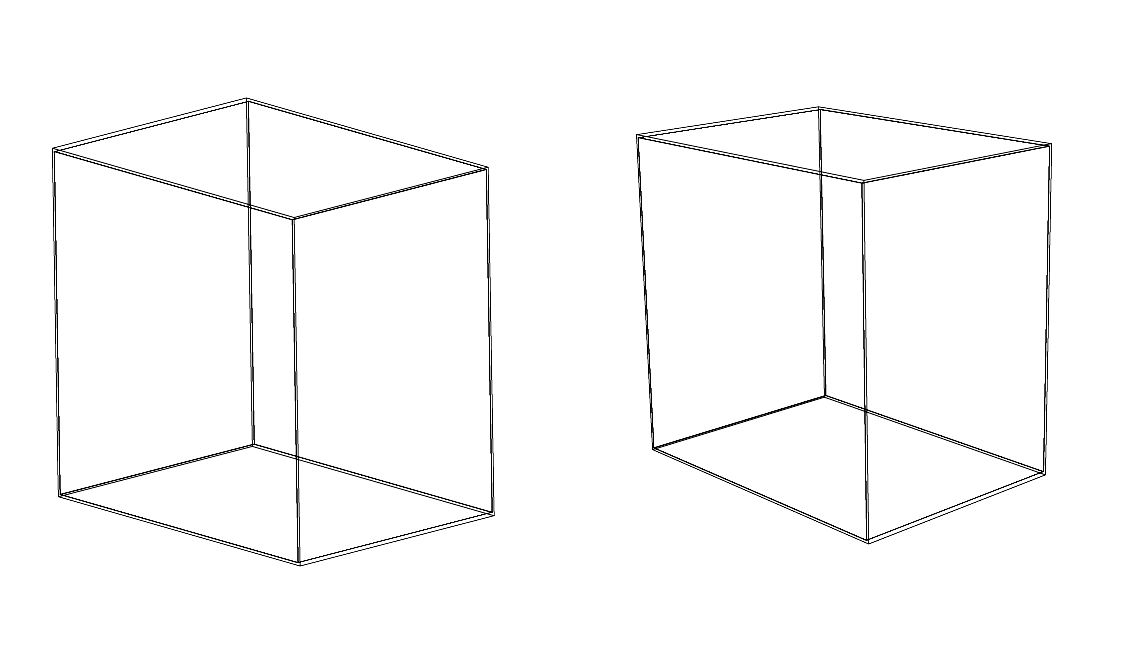
The advantage of ortho view is that it is easier to show detail and geometry (e.g. distances and angles) over the whole 3D diagram rather than just in the foreground. Whereas perspective doesn’t show good detail in the background and it is difficult to relate foreground features to background features.
The disadvantage to ortho view is that we lose the visual cue that perspective gives us.
Back to 3D geology diagram techniques