Adding XY data to ArcGIS
This tutorial covers adding XY data to ArcGIS, so that you can view and work with the data in ArcGIS. By XY data I mean point data such as foliation that has a spatial (XY) component associated with it.
Grid reference systems: how to make them
All about how to make grid reference systems. Before you try to make your own you should read this page:
Grid reference systems: What are they?
This page explains grid reference systems, with specific emphasis on New Zealand. If you are interested in making a grid reference system for your map read this page and then see:
What is a grid reference system?
A grid reference system is a simplified grid used for a map area to make reporting and looking up coordinates easier.
Continue reading
New Zealand Geology Web Map (GNS Science)
New Zealand Geology Web Map is provided by GNS Science and includes geology at 1:1million and 1:250k (QMap) scales. Either watch the video or read the instructions to see how to use the webmap.
How to access New Zealand Geology Web Map
New Zealand Geology Web Map link
How to use New Zealand Geology Web Map (video)
How to use New Zealand Geology Web Map (text)
Interface and Controls
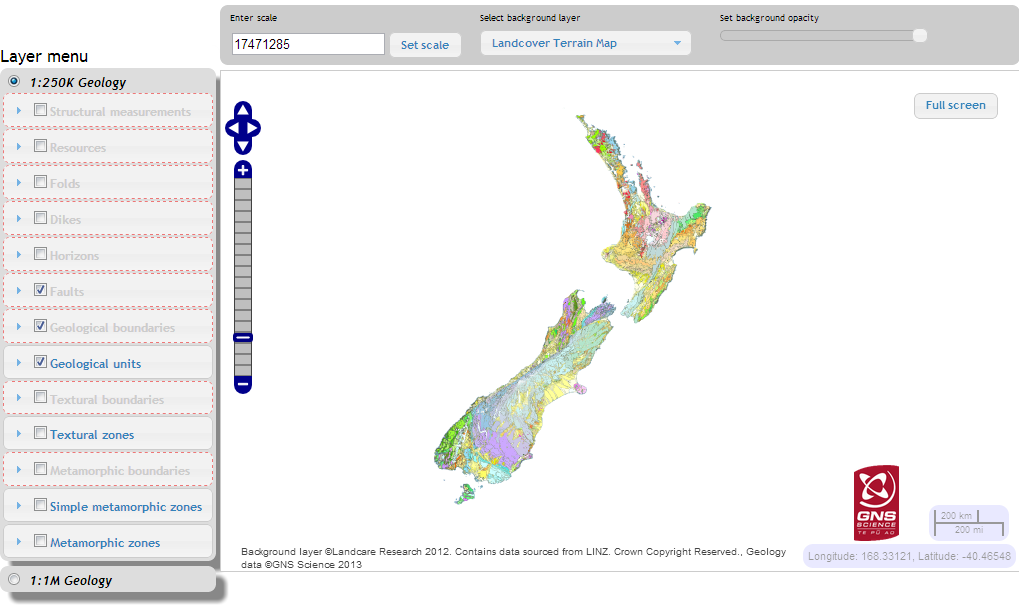
There are two maps you can use by selection in the Layer Menu:
- 1:250k Geology
- 1:1M Geology
Zooming
You can zoom in and out on the map itself by scrolling, dragging or clicking on the map navigation bar ![]() or setting an exact scale in the Enter Scale field, then clicking Set Scale. Scale is only allowed at certain steps so if you enter in a number it will just round to the next step up (away).
or setting an exact scale in the Enter Scale field, then clicking Set Scale. Scale is only allowed at certain steps so if you enter in a number it will just round to the next step up (away).
Panning
Pan by simply clicking and dragging in the map area or use the map navigation buttons.
Layer menu
Items in the layer menu are listed by drawing order. On the QMAP only Geological units, boundaries and faults are displayed by default. To display other units simply check the box in the list.
Items that are greyed out will not display at the current scale, zoom in to see them. All items will display when zoomed in to 250k.
Items can be re-orded by dragging and dropping in the list. To reset the view simply refresh the web browser.
Layer properties
By default all the layers display with 100% opacity. You can change this by clicking on any layer to bring up a drop down menu, go to the Controls tab and adjust the transparency.
From the controls tab you can also view the metadata (e.g. about the data), or view the legend in a new window.
Viewing topo and geology
I recommend setting Geological units to 70% opaque. With translucent polygons you will be able to see the basemap underneath. I recommend changing the basemap to LINZ Topo 250.
Query a point line or polygon
Click on a point, line or polygon on the map to query it. You should get a box that tells you more about the unit selected, such as sense on faults.
Full screen mode
Once you have the map pretty much set up the way you want you can use full screen mode (top right of map window) to get a larger extent opf the map on the screen. Whilst in full screen mode you can resize the browser to get an even larger map view.
![]()
Additional resources
You might also be interested in using the GNS geoserver for bringing in data within an application e.g. WMS using ArcGIS.
Datums and Projections
A basic understanding of datums and projections and how they are used is essential for anyone conducting research with a mapping/spatial component to it.
A reasonably good summary of geodetic datums and projections is written here (read this summary first) : http://www.linz.govt.nz/geodetic/find-out/understanding-datums/index.aspx
Some Key points about datums and projections
In general
- The most important thing to know is what datum + projection the data are in
- When someone gives you data ask about what datum + projection the data are in.
- Check what the GPS is set to!
- People may tell you “The data are in Lat long” this is not a datum, it is a way of expressing the positions in a datum! Latititude and longitude could be given for any datum! (it is most likely that data will be wgs84 datum).
NZ data specifically
- If you are entering location data into a spreadsheet put the datum or projection in the header (e.g. |Easting_NZTM| Northing_NZTM| )
- When reporting eastings and northings report eastings first (like other x,y coordinates). For latitude and longitude, latitude is often reported first (not sure why this is).
- There is ~200m difference between nzgd1949 and nzgd2000 datums
- For NZMG and NZTM the easting is always the smaller of the two (unless you are using it outside of onshore nz- which you shouldn’t).
- NZTM and NZMG Eastings/ northings are of the order of a million metres. So if you see one that that is “123456” or “12345678”, they are wrong (probably mistyped).
- NZMG eastings begin with 2 e.g. 2345346 and NZTM eastings usually begin with 1 (e.g. 1345657). There is no overlap in the coordinates for onshore New Zealand (see map below). This is by design.
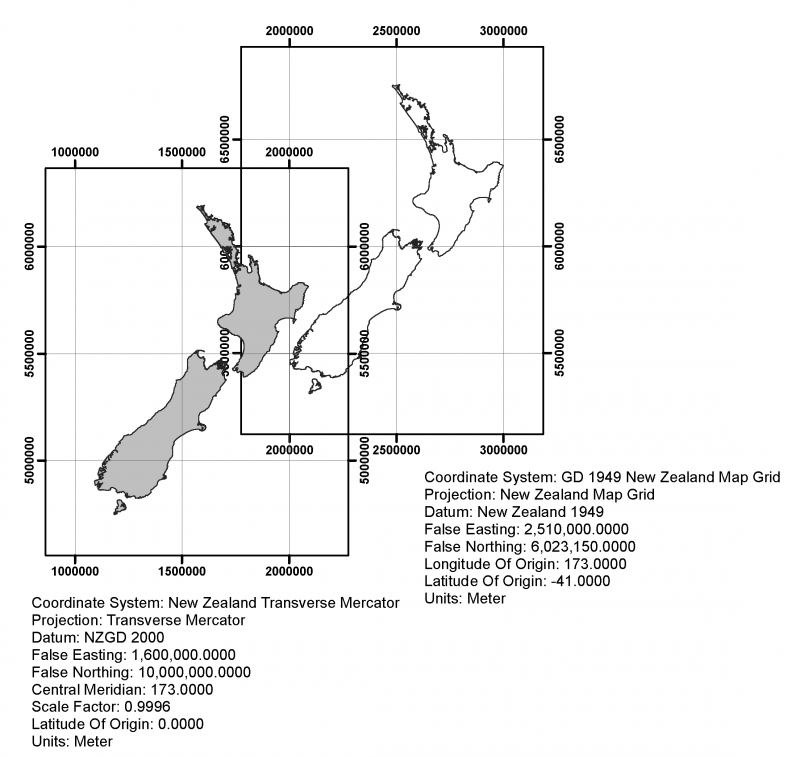
Comparison between projections used in New Zealand
For more info go to: http://www.linz.govt.nz/geodetic/datums-projections-heights
