Adding XY data to ArcGIS
This tutorial covers adding XY data to ArcGIS, so that you can view and work with the data in ArcGIS. By XY data I mean point data such as foliation that has a spatial (XY) component associated with it.
Where to get the files for this tutorial
Adding XY data to ArcGIS screencast
The video below covers most of the steps for adding XY data apart from the problem solving tips that are only covered on this page.
httpv://youtu.be/vmEPsc8NnT0
Adding XY data to ArcGIS text instructions
There are ways to open a spreadsheet directly in ArcGIS, but in my experience there are often problems. It is also possible to convert directly from an excel spreadsheet, but this is unreliable. My preferred technique is to convert from .csv format to shapefile or feature class (in geodatabase).
1.1 Checking the XY data
It’s important to check your data first!
- Get the folder “Add XY data files” and extract it.
- There is a map on the top level and a folder with data in it. This is how I like to manage maps and data in ArcGIS.
- Open the data folder and open up the “foliation-wt.xlsx”
- The data has been prepared so that it is ready to be added into ArcGIS.
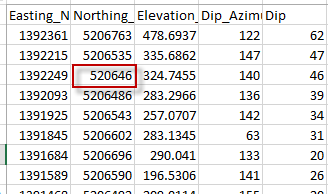
Here are some of the features that make this XY data suitable
- It has a single header row with clearly marked fields
- It has Eastings and Northings and the Map projection is indicated (NZTM).
- All columns with numbers in them only have numbers (they can therefore be recognised as number fields).
1.2 Saving data as CSV
But this data is in excel format. So we need to save it as CSV.
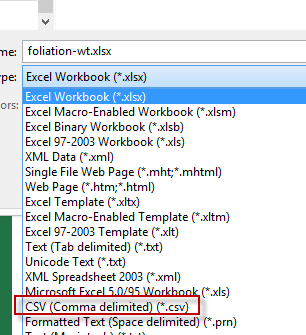
- In excel choose File>Save As and choose the location where the excel file “foliation-wt.xlsx” is stored.
- In save as type choose CSV (Comma delimited) (*.csv)
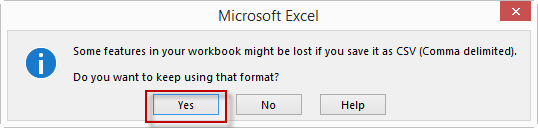
- Excel will warn you that some features will be lost. Select ‘Yes’ we want to save as CSV. CSV is for storing data, it can’t store formulas, graphs, multiple sheets and other things like .xlsx can.
- Close the file. Excel will keep the file open with all excel editable features intact, but will change the file name extension to .csv. This will mean that excel will ask whether you want to save changes when you try to close the file, you can just select “Don’t Save” OR if you haven’t saved some changes you want to preserve in excel format you can do that now.
-
- Open “foliation-wt.csv” in a text editor and see that it is the same data with a comma: ‘,’ between each value (Comma Separated Value).
1.3 Workflow for adding XY data
- Close excel. IMPORTANT you cannot work on the same file in two programs at once. If you try to work on this file in ArcGIS with it still open in excel it will not work.
- Open the map “mxd”. Then open the ArcCatalog sidebar (Windows>Catalog) and navigate to the location where the “foliation-wt.csv” file is stored. i.e Home>
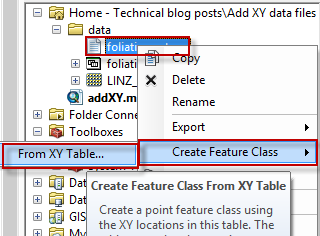
- Right click on “foliation-wt.csv” and choose “Create Feature class>From XY table”
- Choose the correct Input fields from the sheet headers for easting and Northing.
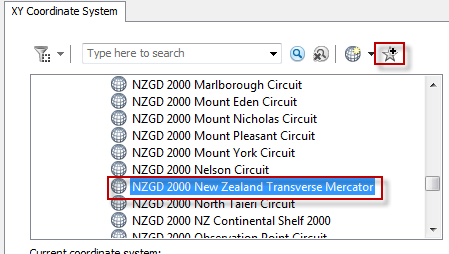
- We need to set the coordinate system of these now. Click on “Coordinate system..” Choose the correct coordinate system (for NZ Go to Projected coordinate systems>National grids>New Zealand and choose NZGD2000 New Zealand Transverse Mercator Projection. )
- It’s a good idea at this point to add the coordinate system to your favourites by clicking on the little star icon. Click OK.
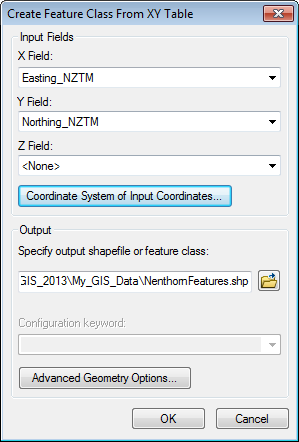
- Set the output to “XYfoliation-wt.shp” in the “data”
1.4 Checking the shapefile you just made
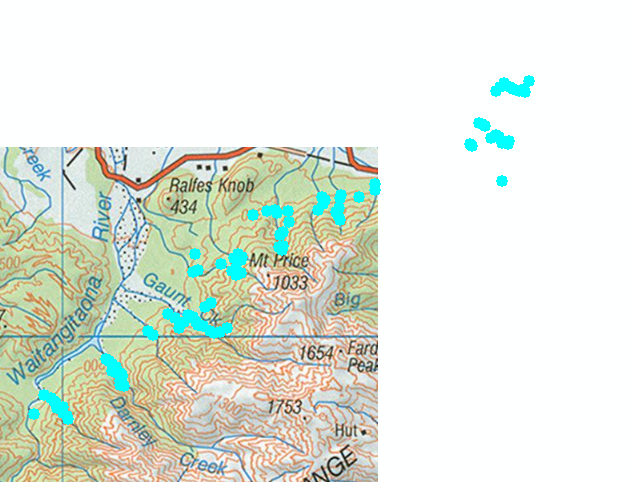
- Now if you look in folder you used in the ArcCatalog Sidebar you will see a shapefile with the name you gave it. Add this to your map by dragging and dropping.
- You can query what each point is using identify . You can also open the attribute table to see attributes for each point (e.g. name). right click on layer>Open attribute table.
- You have just created spatial data (data that can be read by a GIS). You could now throw the .shp file you created into any new map and it will come up in the right place (provided the coordinate system is the same or transformation is set.).
1.5 Things to check for your own datasets
1.5.1 Check that all of you points have plotted where you think they should have
- Use the select tool to select all your data in the area you are working in

- Open up the attribute table and check that all the entries have been selected.
- If some points are not highlighted it might be because they have incorrect eastings and northings. Look at XY data integrity issues in problem solving
1.1.1 Check your attribute table to see that all data have come through as they should have
It’s possible that sometimes ArcGIS will not recognise a field correctly. Look at some of the problem solving techniques below.
1.6 Problem solving
There are often a few issues with adding XY data. This section will cover a few of the common issues and some steps to remedy them.
1.6.1 You didn’t correctly choose the Easting and Northing fields
- If your data don’t plot in the right place then right click on the data file in ArcGIS and choose zoom to layer.
- If all of your points have plotted but in the wrong place it likely is an issue with the fields you choose for import
- ArcGIS often defaults to using Easting for both the Easting and Northing fields. So if you don’t change this your data will plot along a 45 degree line somewhere on the map.
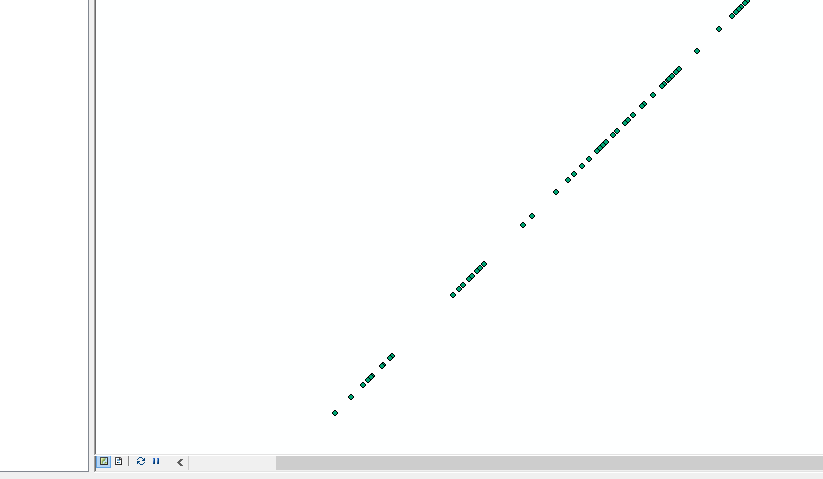
- Go back and start again choosing the correct fields for X and Y
1.6.2 You are trying to use the wrong coordinate system
Make sure you pick the correct coordinate system that your data are in.
- One common mistake is to choose a projected coordinate system (Easting/Northing) when your data are in a geographic coordinate system (Lat/Long). Your data will plot down the lower left near the origin.
- Another common mistake is to choose a geographic coordinate system (Lat/Long) when your data is in a projected coordinate system (Easting/Northing). Your data will not plot at all because it is getting values in millions of metres and expects values from -180 to +180 (degrees).
- Another mistake is choosing the wrong projected coordinate system when there are more than one used in an area. For example choosing NZMG instead of NZTM. This will usually result in the points plotting very far away.
- Another mistake is choosing the wrong geographic coordinate system. E.g. GD49 instead of CG200 in NZ. This will sometimes cause points to plot pretty close to where they should be but with a constant offset of potentially 200m. In some cases the geographic coordinate systems are so similar you won’t be able to tell (e.g. GD2000 and WGS84)
- A less common mistake is to choose the wrong datum/projection combination. This will have the same offset effect as choosing the wrong datum.
1.6.3 ArcGIS can’t work out what data type to use for a column
- This could be because your data have different types in one column. For example you might have a text where there should only be numbers. ArcGIS will not let you use the rest of the numbers in this column as numbers (e.g. in calculations, object rotations)
- Sometimes ArcGIS takes issue if there are too many blank fields at the start of a column (but this might be an issue with older versions as I can’t seem to replicate it)
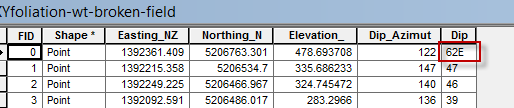
1.6.4 XY data integrity issues
If some of your data isn’t plotting where it should be and you entered the data manually at any stage, then it is likely because you transposed or dropped some numbers. See the example below where a number has been dropped.