Update: I suggest using ArcGIS Pro instead of ArcMap – if you need help with this let me know.
—
This tutorial covers plotting structural geology data in ArcGIS. In this tutorial I am going to use the example of plotting foliation data, but this is applicable to any data where a rotated symbol is required.
Where to get the files
Plotting structural geology data in ArcGIS Screencast
This video covers preparing the data in Excel.
httpv://youtu.be/5BC0sC76ROo
This video covers plotting the structural geology data in ArcGIS
httpv://youtu.be/eiOToVM8gfI
Plotting structural geology data in ArcGIS Text instructions
1.1 Getting the data ready
- To plot foliation data we need a spreadsheet with the locations (easting and northing) and the orientation measurements.
- If you have entered your Strike/Dip and dip direction in a single column you can use Mid, Left and right operations to separate out your data fields.
- Convert “foliation-wt-s-dip” to dip azimuth/dip format.
- If you have used strike/dip/ dip direction you need to change it to Dip Azimuth/Dip.
- The dip azimuth is the direction that the tick on a foliation symbol points. E.g. if you have measured 030/45SE that would be 120/45 in dip azimuth/dip system.
- The easiest way to convert is to create three columns that add 90, subtract 90 or add 270 (alternatively you can do a modulo 360 operation, so that you only need to use two columns) to your strike measurement.
- Create a field for dip azimuth and pick the correct column based on the dip direction. Delete unneeded columns when you are done.
- Create a shapefile from your table of foliation data by referring to these instructions:
Adding XY data to ArcGIS- In brief: Save as CSV. Open “plot-structure-data.mxd”. Right click on CSV in arcCatalog sidebar. Create feature class from XY table. Set fields and coordinate system. Save as shapefile.
- Check “plot-structure-data.mxd” to see that all data is available and plotting in the correct location (check attribute table and map). See Adding XY data to ArcGIS if there are any issues.
1.2 Changing and rotating the symbol.
- The first thing we want to do is change symbol to foliation. There are foliation symbols built in to ArcGIS. There is also a custom font in your tutorial files called “OUGeology1.ttf “This was created using fontstruct (ougeology1 font on Fonstruct ). You can install this font by double clicking on it then selecting install.
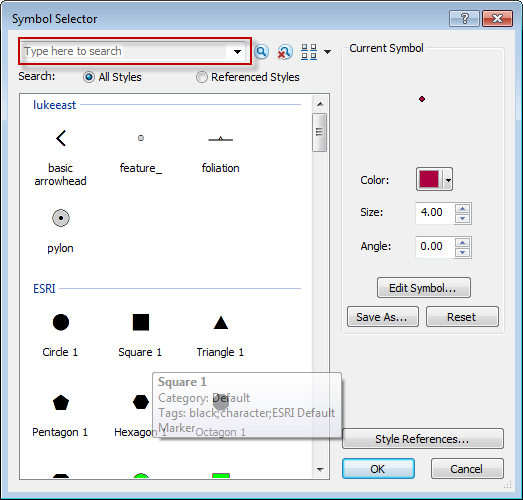
- Open the symbol selector for your foliation points by double clicking on the symbol in Table of contents.
- EITHER use a built in foliation symbol by searching for foliation in the symbol selector ( Within the Symbol Property Editor window ensure that tick is point upwards by adjusting the angle field.)
- OR use the one supplied in the custom font by clicking on Edit Symbol in the Symbol Selector In the Symbol Property Editor:
- Choose Character marker symbol
- Choose OUGeology1 font
- Choose foliation symbol
- Adjust offset to centre symbol
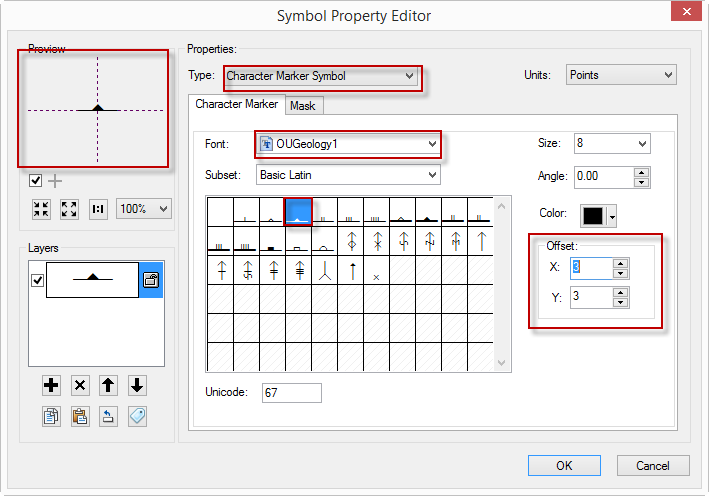
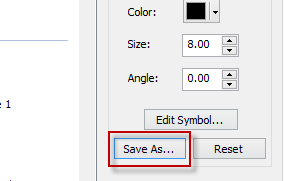
- Click OK and go to save as to store this symbol as foliation for future use
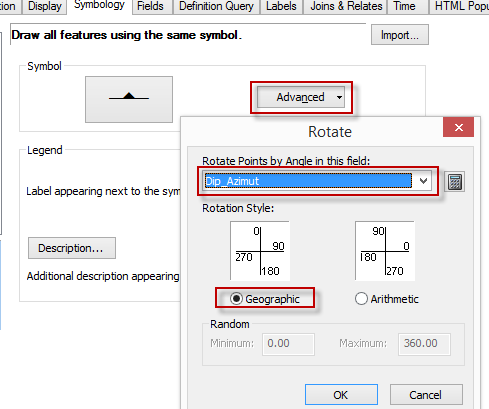
- Go to layer properties>symbology>advanced
- Select rotation and choose dip Azimuth
- Ensure that rotation style is set to Geographic
1.3 Labelling
Probably most problematic aspect of using this software is labelling.
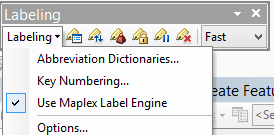
- First we need to enable the maplex labelling engine Which gives us access to advanced labelling features.
- Go to customize>toolbars>Labelling
- Click on labelling and choose use Maplex Labelling engine
- Now go to layer Properties Labels tab.
- Check Label Features in this layer
- Label features with dip
- Click Apply and note the problem with position of labels. We want them to be at the tip of the symbol
- Click on Placement properties.
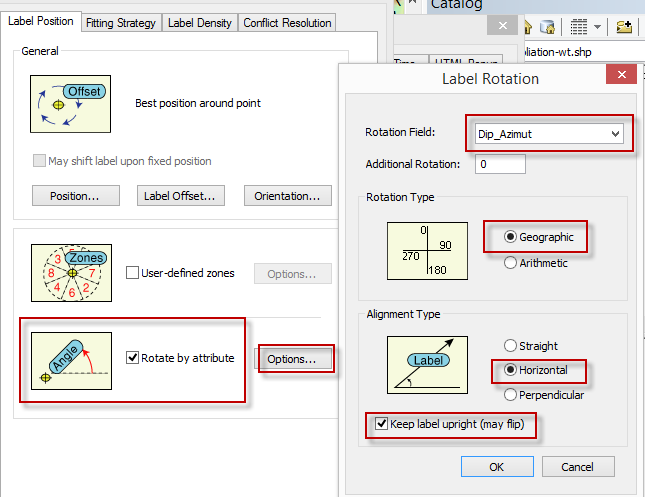
- Choose Rotate by attribute, select Options.
- In label rotation. Choose Dip_azimuth as the rotation field, Choose geographic and choose Horizontral alignment. Click OK.
- The last thing we need to do is adjust the offset. Go to label offset and choose 2 points if from exact feature outline or 6 points from feature geometry. Or whatever you want it to be.
1.3 Representative measurements.
Sometimes we have too many measurements for a particular map at a particular scale. What we want to do instead is take some representative measurements. I will be writing a follow up post on this soon. Which looks at the way you can do this.

10 comments on “Plotting structural geology data in ArcGIS”
Many thanks. Very clear instructions. Solved my problem.
Hello
Thanks for this procedure, it’s very helpful but when I click on Labeling I found “Use Maplex Label Engine” is not activated. What can I do?
Is it greyed out? Which version of ArcGIS are you using? Maybe check in customize>extensions and make sure the maplex one is turned on.
If I want introduce other symbol, for example the symbol of a fold. How can do it in arcmap?.
The easiest way I found (especially for a set of symbols) is to make a font. You could add one to this https://fontstruct.com/fontstructions/show/1080904/ougeology1
There will be other ways, but I don’t know how to make them work well.
Good Luck.
Hi,
Fantastic write up by the way.
I was wondering if you ever got around to producing a write up on how to make the measurements representative?
Thanks
This doesn’t seem correct, unless I am missing something – for a strike and dip symbol (using Arc’s built in symbols) you should be rotating it by the strike, not the dip direction, and simply have to ensure your points follow the right hand rule. I agree that in general dip and dip direction data is much easier to work with, but Arc’s symbols are built around traditional North American field geology where it is strike and dip following RHR. I just went through this exercise using the basic inclined bedding strike and dip symbol and my orientations were incorrect using dip direction, I had to recalculate a strike for everything. Let me know if I am missing something!
Hello Steph, you are right that using the RHR is the way to go. Rotation can be based on strike or dip direction but the rotation style needs to be set to Geographic or Arithmetic depending on your approach and data.
Sir
can you tell the procedure how to plot 3-4 different data at single location without overlapping like a bed, a joint, a foliation and a trend of a line?
Hello, I don’t know of any ideal solution to this. Catrographic Representation is one approach. Another is to use the ‘Disperse Markers’ tool but be aware that this tool moves the points in the source data so should be used with caution on a copy of the data.