Illustration/Graphics resources incl. USGS patterns pack
I’ve just put a new section on this website with Illustration/Graphics resources. In this section is a page with a USGS AI pack instructions and a download link. The pack contains patterns for geological mapping such as schist, limestone and other things. The instructions make it really easy to use.
I will be adding a USGS Inkscape pack soon with instructions. I will also be adding more Illustration/Graphics resources as time permits.
Creating a topo profile and blank cross section using ArcGIS
Creating a topo profile and blank cross section using ArcGIS (Video instructions)
httpv://youtu.be/jEQpwaITkqg
Creating a topo profile and blank cross section using ArcGIS (text instructions)
Get the cross section template
New Zealand Geology Web Map (GNS Science)
New Zealand Geology Web Map is provided by GNS Science and includes geology at 1:1million and 1:250k (QMap) scales. Either watch the video or read the instructions to see how to use the webmap.
How to access New Zealand Geology Web Map
New Zealand Geology Web Map link
How to use New Zealand Geology Web Map (video)
How to use New Zealand Geology Web Map (text)
Interface and Controls
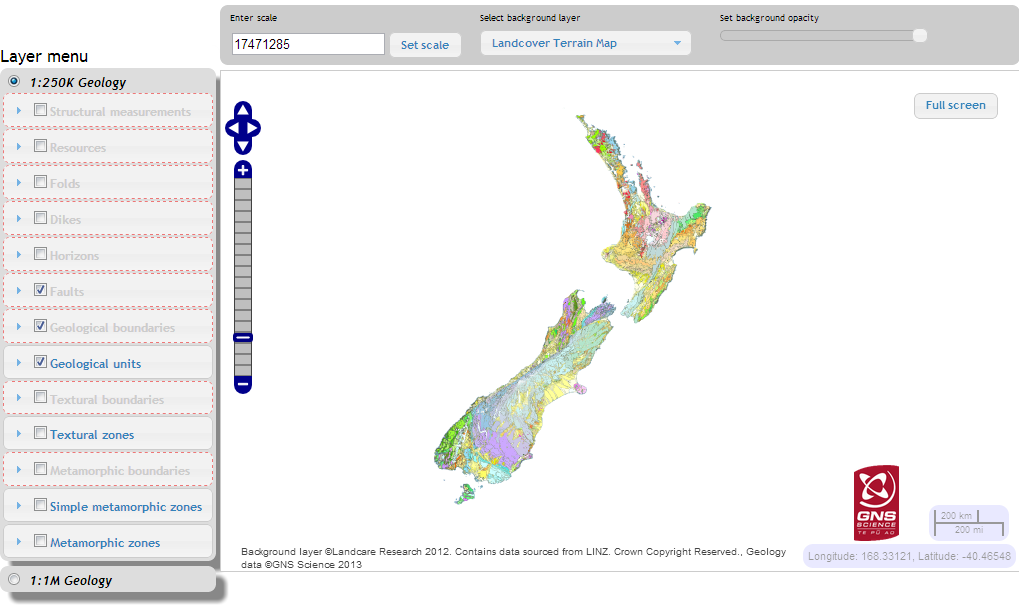
There are two maps you can use by selection in the Layer Menu:
- 1:250k Geology
- 1:1M Geology
Zooming
You can zoom in and out on the map itself by scrolling, dragging or clicking on the map navigation bar ![]() or setting an exact scale in the Enter Scale field, then clicking Set Scale. Scale is only allowed at certain steps so if you enter in a number it will just round to the next step up (away).
or setting an exact scale in the Enter Scale field, then clicking Set Scale. Scale is only allowed at certain steps so if you enter in a number it will just round to the next step up (away).
Panning
Pan by simply clicking and dragging in the map area or use the map navigation buttons.
Layer menu
Items in the layer menu are listed by drawing order. On the QMAP only Geological units, boundaries and faults are displayed by default. To display other units simply check the box in the list.
Items that are greyed out will not display at the current scale, zoom in to see them. All items will display when zoomed in to 250k.
Items can be re-orded by dragging and dropping in the list. To reset the view simply refresh the web browser.
Layer properties
By default all the layers display with 100% opacity. You can change this by clicking on any layer to bring up a drop down menu, go to the Controls tab and adjust the transparency.
From the controls tab you can also view the metadata (e.g. about the data), or view the legend in a new window.
Viewing topo and geology
I recommend setting Geological units to 70% opaque. With translucent polygons you will be able to see the basemap underneath. I recommend changing the basemap to LINZ Topo 250.
Query a point line or polygon
Click on a point, line or polygon on the map to query it. You should get a box that tells you more about the unit selected, such as sense on faults.
Full screen mode
Once you have the map pretty much set up the way you want you can use full screen mode (top right of map window) to get a larger extent opf the map on the screen. Whilst in full screen mode you can resize the browser to get an even larger map view.
![]()
Additional resources
You might also be interested in using the GNS geoserver for bringing in data within an application e.g. WMS using ArcGIS.
Keeping a symbols document
Why and how?
Sometimes we use the same symbols over and over in different documents. It might be easiest with some of these symbols to store them in a ‘symbols’ document. You should use the native format for whatever software you are using, i.e. if using illustrator use an .ai file. You could store this symbols document on the desktop.
Why use this approach?
Most software has more sophisticated ways to store symbols, the downside to these are that they are a little complicated. This approach is super simple.

Some symbols that I commonly use, and copy to new documents.
