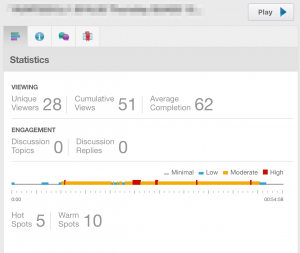
What statistics can I get for an individual recording on Otago Capture?
Now that the end of the year is heading towards us I thought it might be a good idea to go over some of the useful statistics you can get from the Otago Capture Lecture Recording System.
First let’s look at the statistics you can get for each individual recording in a section.
In this example we can see that 28 students have viewed this recording and collectively those 28 students have viewed it 51 times. And the average amount the students watched was 62%. There have been no discussions on this recording though.
A quick note on what constitutes a view. On Otago Capture a view is when a student has watched more than 90 seconds of a recording.
The Usage Heat Map
The Heat Map is a really cool feature of Otago Capture, it takes all of the views the recording will have and gives you a graphical representation of those views. Areas that are coloured have been viewed, blue for low views, yellow for moderate views and red for high views. Heat Maps are also interactive; so if you click on any spot in the Heat Map you will be taken to that point in the recording.
The Heat Map in this example is really interesting; usually what we will see is a map that skews towards the start of a recording, but this has basically nothing for the first 10 minutes. This could be for a number of reasons, if the lecture started late for example. As we can see here 24 minutes in is a hot spot.
Hot spots can be created by more than just student views. If a student bookmarks a particular time slot, or searches for a slide then Capture will take that into account when creating the heat maps.
This is a just a quick look at what you can get from each individual recording. Otago Capture has many more statistics you might find useful; including individual student reports and an overview of all recordings. If you want to know more check out the Statistics and Reports page on the Capture help site or leave a comment below.


