Illustration/Graphics resources incl. USGS patterns pack
I’ve just put a new section on this website with Illustration/Graphics resources. In this section is a page with a USGS AI pack instructions and a download link. The pack contains patterns for geological mapping such as schist, limestone and other things. The instructions make it really easy to use.
I will be adding a USGS Inkscape pack soon with instructions. I will also be adding more Illustration/Graphics resources as time permits.
New Zealand Geology Web Map (GNS Science)
New Zealand Geology Web Map is provided by GNS Science and includes geology at 1:1million and 1:250k (QMap) scales. Either watch the video or read the instructions to see how to use the webmap.
How to access New Zealand Geology Web Map
New Zealand Geology Web Map link
How to use New Zealand Geology Web Map (video)
How to use New Zealand Geology Web Map (text)
Interface and Controls
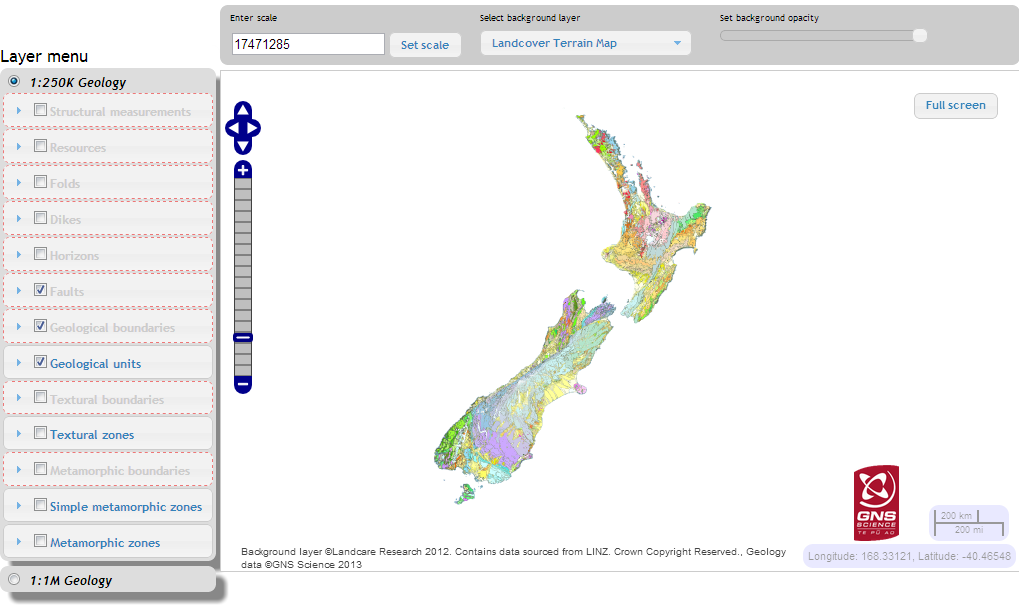
There are two maps you can use by selection in the Layer Menu:
- 1:250k Geology
- 1:1M Geology
Zooming
You can zoom in and out on the map itself by scrolling, dragging or clicking on the map navigation bar ![]() or setting an exact scale in the Enter Scale field, then clicking Set Scale. Scale is only allowed at certain steps so if you enter in a number it will just round to the next step up (away).
or setting an exact scale in the Enter Scale field, then clicking Set Scale. Scale is only allowed at certain steps so if you enter in a number it will just round to the next step up (away).
Panning
Pan by simply clicking and dragging in the map area or use the map navigation buttons.
Layer menu
Items in the layer menu are listed by drawing order. On the QMAP only Geological units, boundaries and faults are displayed by default. To display other units simply check the box in the list.
Items that are greyed out will not display at the current scale, zoom in to see them. All items will display when zoomed in to 250k.
Items can be re-orded by dragging and dropping in the list. To reset the view simply refresh the web browser.
Layer properties
By default all the layers display with 100% opacity. You can change this by clicking on any layer to bring up a drop down menu, go to the Controls tab and adjust the transparency.
From the controls tab you can also view the metadata (e.g. about the data), or view the legend in a new window.
Viewing topo and geology
I recommend setting Geological units to 70% opaque. With translucent polygons you will be able to see the basemap underneath. I recommend changing the basemap to LINZ Topo 250.
Query a point line or polygon
Click on a point, line or polygon on the map to query it. You should get a box that tells you more about the unit selected, such as sense on faults.
Full screen mode
Once you have the map pretty much set up the way you want you can use full screen mode (top right of map window) to get a larger extent opf the map on the screen. Whilst in full screen mode you can resize the browser to get an even larger map view.
![]()
Additional resources
You might also be interested in using the GNS geoserver for bringing in data within an application e.g. WMS using ArcGIS.
Focus stacking images
This article has been specifically written for using the macro-photography setup in the Graphics Lab in the geology department and Adobe Photoshop CS5. Concepts are applicable to other equipment and versions of Photoshop.
UPDATE:
I have made a new post with instructions using Zerene stacker to stack the images rather than photoshop because it is faster, easier and produces better results in all cases that I have seen. For example Zerene Stacker took 72s to stack 11 images and photoshop took 125s, the difference in stacking speed is even more pronounced when more images are used.
Margins for printing
Document types and margins
Typically for text documents such as articles, or reports there will be more than 3mm of white margins all around the documents so there is little need for us to concern ourselves with printer margins. It is only when we create posters, fliers and booklets that we need to consider printing margins.

Margins and professional printing
If we are going to a professional printer then we can create documents that go right up to the edges and they will be able to print these. Sometimes bleed will need to be added (where extra colour is printed around the edges of a document) that is later trimmed off by the printer. The use of bleed ensures that the colour goes right to the edges of printed documents.
Margins for consumer printers that use sheets
Most consumer printers will not print right up to the edges of paper and commonly require around 3mm of margins all around the document. This doesn’t mean that it is necessary to leave 3mm of edges white, if the document has colour right up to the edges then the last 3mm of colour will simply not be printed.
It should be noted that we do not want text to be right up against the margin even if it is not cut-off. We usually want at least a cm between the text and the edge of a page.
Ideally we could have considered the margins before we started making the document. If we have not there are a couple of options available to us.
- We could modify the document so that there is at least 3mm of margin (or content that will not be printed)
- We can simply scale the document when we print it
If we are using option 1 above then the exact approach will depend on the software used to edit the document. If we are using option 2 then the approach will depend on the software used to print the images.
Printing and scaling
Printing can be kind of confusing because of the variation and duplication of options between the software used to print, the printer drivers and potentially the printer itself.
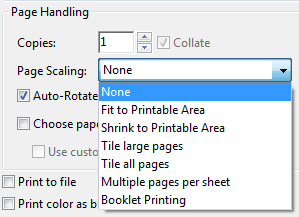
There is usually an option in the software used to print that allows you to scale the page to fit the printable area (paper – printer margins). If you are printing to A4 and your printer needs 3mm of margin then the printable area will be 297mm-3mm= 294mm by 210-3mm=207mm, which equates to scaling by 97%.
Margins for large format printing on the geology plotter
For a breakdown on printing on the geology plotter (large format printer for posters maps etc.) please look at this poster: printing_on_the_plotter
TIP: A good trick with printing is to print a document to a pdf first to check if there are any issues with printing. Be aware that saving to a pdf in word reduces qualtiy of graphics, it is best to print to a pdf. Most professional printers prefer printing from pdf format (including otago uniprint) for text documents (e.g. theses).
Pixel count, pixel density, document size, dots per inch, optical resolution
There are a lot of articles out there on the web that discuss these topics. Although understanding these concepts is inherently a little tricky, the biggest problem is the lack of consistent and unambiguous naming. In this post I will describe what these things are as unambiguously as possible. I find that sometimes its easiest to describe what you mean rather than using these names.
Definitions
Pixel count (aka pixel dimensions, resolution)
The number of pixels in an image may be reported as
- a width * height e.g. 1024*768pixels
- a total number of pixels e.g. for cameras: 2450*3700 = 9065000 Pixels = ~9 Megapixels
Pixel density (aka: digital resolution, resolution)
Often incorrectly referred to as dots per inch (see description for DPI below)
A measure of the density of the pixels in physical space. For example how many pixels in one linear inch (PPI).
This may be reported for screens; for example a 1920*1080 monitor that is 26.7inches across will have a pixel density (resolution) of 1920/26.7 = 72ppi. Note that most monitors with this pixel count are smaller (maybe 23inches) and thus have a pixel density (resolution) higher than 72ppi.
Raster images (e.g. photos) also have a value stored for pixel density (resolution). By default most cameras will set this value to 72ppi.
If you are scanning something than you may choose a resolution for scanning such as 300ppi for documents and 1000ppi for slides. In this case it is most likely that the value stored in the file will be this value.
Document size (aka: image size, presented size)
Not to be confused with image file size (aka: image size) which is the size of the image file i.e. 2.5MB.
Document size is the physical dimensions that an image has (perhaps measured in cm or mm). This is easier to get your head around for printed material where we can just get out a ruler to measure the image size.
For raster images (e.g. photos) on a computer the document size is actually just whatever is calculated using the pixel count and the pixel density.
pixel density = pixel count (in one direction)/ image size (in one direction)
For example if an image is 2400pixels across and has a pixel density of 300ppi than the document size will be 2400/300 = 8 inches = 203.2mm, that’s slightly less than the width of an A4 page.
Dots per inch (aka: printed resolution, dot density)
Printers have limited colours (usually just cyan, magenta, yellow and black). In order to create all the colours and tones for a photo these colours are printed in variable amounts as a dot pattern. If you look closely at a printed page or use a magnifying glass you can see this dot pattern.
The higher the number of dots per inch there is in a printed image the greater the level of detail typically. More dots are required than the pixel count to get the same detail as an image on a screen. Printers will typically print at 300dpi, 720dpi or higher.
Dots per inch is commonly used interchangeably with pixels per inch. This is wrong. Pixels per inch is the correct term for pixel density on a computer and dots per inch is the correct term for printed images.
Optical resolution
Optical resolution is a measure of the ability to resolve detail in an image. A simple way to measure this is to imagine the smallest and closest possible objects that can be resolved as two distinct objects.
This is perhaps the least considered aspect of images and image capture (e.g. photography, scanning) and one of the most important. Optical resolution, is perhaps the only true resolution.
While the pixel count sets an upper limit for optical resolution it is generally the optics of the image capture system and in the case of photography the quality of the camera and skill of the photographer that determine the optical resolution.
To understand how pixel count is different to optical resolution let us consider two examples:
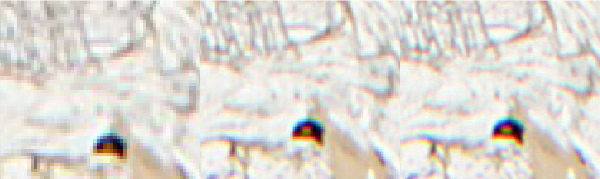
- If an image is out of focus then it will have a lower optical resolution than an image in focus that is captured using the same pixel density.
- A slide scanner can capture at 1200ppi, 2400ppi or 4800ppi, however due to the optical resolution limit of the scanner there may be no difference in optical resolution at 4800ppi vs 2400ppi. At 1200ppi the optical resolution of the image captured is lower than at 2400ppi because the pixel density is now the determining factor. See image below.