About Richard White

University Copyright Officer

Aiming for 70% open access: New Zealand universities unofficial league tables 2023

Monday, September 11th, 2023 | Richard White | No Comments

This year Te Pōkai Tara Universities New Zealand released a Pan-university Statement on Open Access. The statement included a goal to:

Increase open access across our university repositories from 48% of published research (current) to 70% by 2025. This is possible if all eight universities deposit all eligible manuscripts into their repositories.

On Friday 8 September I facilitated a discussion among colleagues from other university libraries, many of whom manage our repositories. We had a couple of people from Crown Research Institutes too. I asked the group: what exactly does this target mean? How do we assess it?

As a first step, we worked together using the wonderful OpenAlex tool to create some league tables as a means of friendly competition.

First of all, if we look at all works in OpenAlex (about 20 years’ worth), what proportion of them are open?

ALL TIME (i.e. 2000-2023) %
Auckland 41
AUT 37
Landcare 36
AgResearch 36
Otago 36
Waikato 34
Lincoln 33
Canterbury 32
VUW 30
Massey 30

All the proportions here are low, which is to be expected as generally speaking the amont of open access publications has increased markedly in the last 5-10 years.

If we look at the rates over the most-recent three years, we get a much different picture:

Three-year period 2020-22 %
AgResearch 64
Landcare 58
Otago 55
Canterbury 55
Massey 52
VUW 51
Auckland 51
Waikato 50
AUT 50
Lincoln 49

Interestingly, the CRIs are taking the lead here. The universities have a fairly tight grouping around and just over half of our work being open.

What about the most recent whole year, 2022?

2022 (most recent full year) %
AgResearch 69
Landcare 63
Otago 59
Canterbury 57
Massey 57
AUT 56
Lincoln 55
VUW 53
Auckland 53
Waikato 52

The CRIs remain out in front. For the universities, 2022 is the first year we would see some impact from Read and Publish deals and we do see the 2022 openness is higher than the three-year figures from the previous table. (Digging deeper into the OpenAlex data we can see the number of “Hybrid” publications has increased markedly in 2022 and 2023, a topic for another post perhaps.)

Finally, what about a running total for 2023, as things stand in September?

2023 (running total) %
AgResearch 69
Landcare 66
Otago 62
Canterbury 62
Lincoln 60
Massey 59
AUT 58
VUW 55
Auckland 54
Waikato 51

The trend is very clearly upwards, with the CRIs nearing 70% and the highest univerities topping 60% now.

All these tables are to suggest that there are different ways of assessing the proportion of open — and that when we check makes a difference. It is clear that the proportion is increasing year-by-year.

After creating these “league tables”, the group dicussed a range of things, including:

  • There is no “right” way to assess our proportion of open. So it may be that we could use a range of measures, as per the different tables here.
  • Embargo periods: one year is the most common, and after two years 90% of journal articles will have passed their embargo period (with the remaining 10% almost exclusively with one publisher). It might be reasonable to assume any accepted manuscripts of closed articles more than two years old could be deposited in an institutional repository without having to determine embargo periods for each and every artilce (excluding that one publisher).
  • The data we are talking about here only includes publications with a DOI. For some institutions a lot of research does not have a DOI. This is a limitation of this kind of assessment. But it’s clear we should place this caveat on all these measurements.

Can I legally use generative AI content in an open educational resource?

Tuesday, July 25th, 2023 | Richard White | No Comments

When you’re making an open book or resource commonly you will want to rely on things that other people have made. However, it’s quite possible you might struggle to find openly-licensed text or images for something and turn to Genrative AI to make your own version. Here is a quick guide to copyright, Gen AI and making your own open book — not legal advice, yada yada yada.

The first thing to say is that this is a rapidly evolving area and there are some uncertainties. As with everything, when in doubt consult your local copyright expert.

Who owns stuff I made using generative AI? 

With Gen AI services, always read the terms of use. Different services have different terms and this is what determines who owns output from Gen AI.

To use Open AI’s terms of use as an example (as at 25 July 2023), in short, they claim no ownership over anything you provide as input or receive as output (see 3(a)). So, that would mean you might* own an image made by Dall-E or text generated by Chat GPT and can then use it in an open text and, as copyright holder, apply a Creative Commons licence to it.

Wait, what did you mean by “might*”?

All Open AI is saying is they don’t claim any rights in what you put in or what their tools put out. In other words, there might be existing rights or new rights created but they’re not party to those. So, when I say you might own the copyright in an output, I have these things in mind:

  1. You shouldn’t input anything that you don’t own in the first place, as that might be an infringing act itself. (Also likely against the terms of use).
  2. Some would assert Gen AI is illegally using copyright material for training itself, which might make anything it produces infringing. (This will be tested in the courts, where Gen AI firms will use fair use as their defence. This might succeed under US law.)
  3. Owning copyright in output would depend on the degree to which it was original. Copyright requires some form of originality.
  4. Output could, by chance, be so similar to something that already exists that you could breach the copyright in that original (their Terms 3 (b)).

It’s also worth noting that different countries have different laws about copyright and things that are computer-generated but that is another area of uncertainty. In New Zealand the Copyright Act specifies that an “author” includes someone who made the arrangements for something to be generated by computer (s 5 (2) (a)).

So, can I use it in my open textbook?

Personally, I would use Gen AI to make something to save me time provided that thing was sufficiently “common knowledge” or not especially original that neither input or output were objectively the same as something that already exists. This, in fact, is pretty much how things work with copyright outside of Gen AI considerations.

I would also recommend (as do Open AI) being transparent about when you’ve used Gen AI to make something.

As an example, if I wanted a diagram representing a standard molecular process, I might be able to prompt an output that used multiple sources to produce something original; however, if I simply wanted to replace a particular process described in only one or two places, and the output closely resembled those, I would be very cautious. The “gut feeling” test is: would someone look at this and be able to say “that is a copy of X by author Y!”

Open textbooks at Otago

Tuesday, May 3rd, 2022 | Richard White | No Comments

Read on to find out about open texts and the 2022-23 open textbook project but it may be easier to simply get in touch with the project team:

Why open textbooks?

Do you have trouble getting students to engage with a textbook? How many of them buy a copy? Perhaps the library can’t get a licence to an ebook version? Are you worried about inequities amongst your students having access whenever and whenever they need it?

Open textbooks may provide a solution, where the whole resource is free and online for a whole class to access without logins or restrictions on downloads or printing. There are many high-quality ones already available – licensed for reuse and adaptation – whether you want something that covers academic writing skillsanatomy and physiology or something more specific like this psychology text adapted for use in New Zealand.

One open text developed locally has since 2015 been viewed over 500,000 times by more than 200,000 people across the world. How is that for real-world impact and visibility? — good for PBRF and your profile!

Reasons to consider incorporating OERs into your teaching practice:

  • affordability – every student begins the semester with free access to the same learning materials
  • access and accessibility – students have permanent free access to resources in multiple formats (for an example, select ‘Download this book’ on this resource to see the different formats available)
  • equity – OER can help improve grades, particularly for students from low socio-economic and ethnically diverse backgrounds
  • retention – students using open textbooks are more likely to complete than those using commercial texts
  • deeper learning – OER enable teachers to customise their curriculum, creating deeper engagement for students
  • diversity – OERs can reflect diversity in student populations by including gender neutral language, culturally diverse names and first nations representation and recognition.

The Open Textbook project 2022-23

The project is an initiative of the Consortium of Australian University Librarians (CAUL), with about 30 universities taking part in Australia and New Zealand. Otago can have two books published on the Pressbooks platform each year, so talk to us about signing up as soon as possible.

CAUL has extensive further information available:

Examples of open texts created in and for New Zealand

Open Access Week 2021 online seminars – Building Structural Equity into Access to Knowledge

Monday, October 25th, 2021 | Richard White | No Comments

Open Access Week 2021 (Oct 25-29) – It Matters How We Open Knowledge: Building Structural Equity

This week Open Access Australasia hosts a series of online discussions on the theme of building structural equity into access to knowledge. Can open practices improve our scholarly communication and publishing ecosystem? How can we ensure every learner has access to the resources we use in teaching and learning? What does open research look like through the lens of indigenous perspectives of knowledge?

Registration is free via the OAA website and times are NZ-timezone friendly. Highlights include:

Shaking up the Culture of Research Assessment (Tu 26 Oct 2-3pm)
How to Address Global Challenges with Open Science (W 27 Oct 4-5pm)
Indigenous voices: research principles through a First Nations lens (Th 28 Oct 2-3pm)
Another Kind of Open: exploring the benefits and barriers to the creation and use of open educational resources (F 29 Oct 2-3pm)
Making Research Truly Accessible: insight unshared is thwarted potential (F 29 Oct 4-5pm)

Details about each session and speakers/panelists are on the OAA website.

Science publishing has opened up during the coronavirus pandemic. It won’t be easy to keep it that way (re-post from The Conversation)

Monday, July 27th, 2020 | Richard White | No Comments

Dr Ginny Barbour, Director of the Australasian Open Access Strategy Group writes in The Conversation today.


Shutterstock

Virginia Barbour, Queensland University of Technology

Scientific publishing is not known for moving rapidly. In normal times, publishing new research can take months, if not years. Researchers prepare a first version of a paper on new findings and submit it to a journal, where it is often rejected, before being resubmitted to another journal, peer-reviewed, revised and, eventually, hopefully published.

All scientists are familiar with the process, but few love it or the time it takes. And even after all this effort – for which neither the authors, the peer reviewers, nor most journal editors, are paid – most research papers end up locked away behind expensive journal paywalls. They can only be read by those with access to funds or to institutions that can afford subscriptions.

What we can learn from SARS

The business-as-usual publishing process is poorly equipped to handle a fast-moving emergency. In the 2003 SARS outbreaks in Hong Kong and Toronto, for example, only 22% of the epidemiological studies on SARS were even submitted to journals during the outbreak. Worse, only 8% were accepted by journals and 7% published before the crisis was over.

Fortunately, SARS was contained in a few months, but perhaps it could have been contained even quicker with better sharing of research.

Fast-forward to the COVID-19 pandemic, and the situation could not be more different. A highly infectious virus spreading across the globe has made rapid sharing of research vital. In many ways, the publishing rulebook has been thrown out the window.


Read more:
The hunt for a coronavirus cure is showing how science can change for the better


Preprints and journals

In this medical emergency, the first versions of papers (preprints) are being submitted onto preprint servers such as medRxiv and bioRxiv and made openly available within a day or two of submission. These preprints (now almost 7,000 papers on just these two sites) are being downloaded millions of times throughout the world.

However, exposing scientific content to the public before it has been peer-reviewed by experts increases the risk it will be misunderstood. Researchers need to engage with the public to improve understanding of how scientific knowledge evolves and to provide ways to question scientific information constructively.


Read more:
Researchers use ‘pre-prints’ to share coronavirus results quickly. But that can backfire


Traditional journals have also changed their practices. Many have made research relating to the pandemic immediately available, although some have specified the content will be locked back up once the pandemic is over. For example, a website of freely available COVID-19 research set up by major publisher Elsevier states:

These permissions are granted for free by Elsevier for as long as the Elsevier COVID-19 resource centre remains active.

Publication at journals has also sped up, though it cannot compare with the phenomenal speed of preprint servers. Interestingly, it seems posting a preprint speeds up the peer-review process when the paper is ultimately submitted to a journal.

Open data

What else has changed in the pandemic? What has become clear is the power of aggregation of research. A notable initiative is the COVID-19 Open Research Dataset (CORD-19), a huge, freely available public dataset of research (now more than 130,000 articles) whose development was led by the US White House Office of Science and Technology Policy.

Researchers can not only read this research but also reuse it, which is essential to make the most of the research. The reuse is made possible by two specific technologies: permanent unique identifiers to keep track of research papers, and machine-readable conditions (licences) on the research papers, which specify how that research can be used and reused.

These are Creative Commons licences like those that cover projects such as Wikipedia and The Conversation, and they are vital for maximising reuse. Often the reading and reuse is done now at least in a first scan by machines, and research that is not marked as being available for use and reuse may not even be seen, let alone used.

What has also become important is the need to provide access to data behind the research papers. In a fast-moving field of research not every paper receives detailed scrutiny (especially of underlying data) before publication – but making the data available ensures claims can be validated.

If the data can’t be validated, the research should be treated with extreme caution – as happened to a swiftly retracted paper about the effects of hydroxychloroquine published by The Lancet in May.


Read more:
Not just available, but also useful: we must keep pushing to improve open access to research


Overnight changes, decades in the making

While opening up research literature during the pandemic may seem to have happened virtually overnight, these changes have been decades in the making. There were systems and processes in place developed over many years that could be activated when the need arose.

The international licences were developed by the Creative Commons project, which began in 2001. Advocates have been challenging the dominance of commercial journal subscription models since the early 2000s, and open access journals and other publishing routes have been growing globally since then.

Even preprints are not new. Although more recently platforms for preprints have been growing across many disciplines, their origin is in physics back in 1991.

Lessons from the pandemic

So where does publishing go after the pandemic? As in many areas of our lives, there are some positives to take forward from what became a necessity in the pandemic.

The problem with publishing during the 2003 SARS emergency wasn’t the fault of the journals – the system was not in place then for mass, rapid open publishing. As an editor at The Lancet at the time, I vividly remember we simply could not publish or even meaningfully process every paper we received.

But now, almost 20 years later, the tools are in place and this pandemic has made a compelling case for open publishing. Though there are initiatives ongoing across the globe, there is still a lack of coordinated, long term, high-level commitment and investment, especially by governments, to support key open policies and infrastructure.

We are not out of this pandemic yet, and we know that there are even bigger challenges in the form of climate change around the corner. Making it the default that research is open so it can be built on is a crucial step to ensure we can address these problems collaboratively.The Conversation

Virginia Barbour, Director, Australasian Open Access Strategy Group, Queensland University of Technology

This article is republished from The Conversation under a Creative Commons license. Read the original article.

Put your work in a repository (Open Access Week 2019)

Thursday, October 24th, 2019 | Richard White | No Comments

Yesterday we focused on the citation advantage for open access articles, particularly for repository-based articles. Today’s post is a guest post by Fiona Glasgow of our Research Support Unit.

There are many ways to make your work openly available. One option is to deposit your work in an institutional repository; at Otago we have OUR Archive. An institutional repository aims to collect, preserve, and make available digital copies of the intellectual output of an institution.

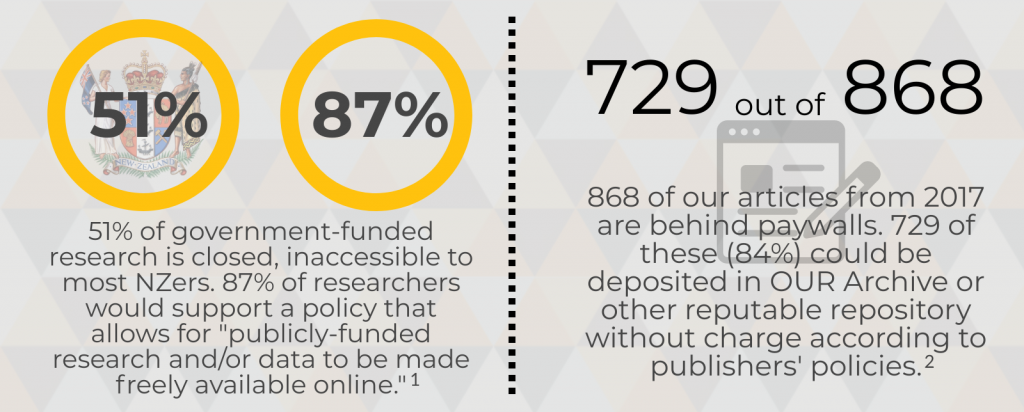
Around 80% of journals will allow you to deposit your research in an institutional repository after a certain time has elapsed from the date of publication – for free! This time period is often 6-12 months, though some but you will need to double check the contract you signed with the publisher or the policies on their websites. Alternatively, you can check this information on SHERPA/RoMEO. This site is a great way to find publisher copyright and self-archiving policies. As mentioned in Richard’s posts earlier this week, 84% of Otago-authored articles from 2017 that are currently behind a paywall could now be legally deposited in a repository.

Some benefits of using OUR Archive include:

  • Making your research visible and accessible. Publications are indexed by search engines (Google, Google Scholar, DigitalNZ, etc); this can increase the ranking of your publications in Google searches and help them reach a broader audience.
  • Providing persistent access. Each item is assigned a unique handle (persistent URL).
  • Gathering statistics on views and downloads. Usage statistics are available for all items and department collections in OUR Archive, and include statistics based on city and country.

Associate Professor Janet Stephenson, Director of the Centre for Sustainability, makes a succinct and compelling case for the benefits of using OUR Archive in this short video interview. She talks about how using OUR Archive has been a critical part in getting the right kind of profile and impact for the Centre’s research outputs, and how increasing access to their work is important for PBRF.

Currently, the majority of research that is deposited into OUR Archive are theses, but it’s possible to deposit a wide range of research outputs, and file types. Over the coming months, the Library is going to focus on increasing the number of non-thesis deposits in OUR Archive. If you have questions or need assistance with the depositing process, please contact your subject librarian.

In early 2020, the Research Support Unit is planning upload-a-thons where librarians will help you deposit your research outputs in OUR Archive. These upload-a-thons also aim to demystify copyright and open access. By going into departments, we hope to tailor the events to your own domain-specific research needs – so bring along any questions you have and works you want to deposit. We hope to see you there!

Open research has more impact (Open Access Week 2019)

Wednesday, October 23rd, 2019 | Richard White | No Comments

So far this Open Access Week, there’s a chance I’ve depressed readers of this blog. “2 out of 5 Otago articles are free-to-read?” I hear you moan. “Access to research costs us how much?!?” you wail. But I did suggest that there are reasons to be positive.

Open access is often framed as being the right thing to do: the public paid for it so they should have access. That’s not my focus here and the research I’ve been discussing this week sought to look for measurable ways in which we can assess the effect that making your work open has on its impact.

Increasingly the agencies that fund our work are looking at impact, in particular with a new focus on impact outside academia (see MBIE’s recent position paper on research impact). Research that is referenced by policymakers and the media is more likely to have real-world outcomes than research that is cited only by the academic community. In our sample we found that open articles were cited in the media 3.5 times more than closed ones and mentioned in policy documents twice as often.¹

Another, more traditional, way to asses this is our old favourite academic citation rates.

Let’s examine the graph in some detail.

  • Closed access articles (n=1480) – that is, those available only via subscription – fare worse than all the types of open access apart from the bottom one (Diamond).
  • Hybrid articles (n=89) – those in subscription journals where you have the option of paying for your single article to be open – achieve the highest average. This result is not surprising as they are likely to be high-profile publications (a topic for further investigation for us). It comes at a cost, with the average Article Processing Charge (APC) being $4260 and totaling $93,000 in 2017.
  • Green OA (n=237) – self-archiving or repository-deposited work – is almost on a par with Hybrid. Self-archiving incurs no APC, of course, and its average citation rate in our Otago sample is 93% higher than closed research (compared to a 66% advantage for all New Zealand universities).
  • Bronze articles (n=162) – those articles whose open status is uncertain but are currently free-to-read – and Gold have similar average citation rates. Gold cost us an estimated $643,000 dollars at an average APC of $2873.
  • Diamond journals are those in which is free to publish and free to read. These represent a small subset of our data (n=41) and are mostly small, independent journals.

The Green result is most interesting in the context of yesterday’s discussion, where we saw that we could be depositing the majority of our closed research in repositories, avoiding APCs. But we are not and thus we’re missing out on the citation advantage we see for Green OA here. To compound this, we’re missing out compared to other countries we would normally like to compare ourselves to, which have much higher rates of openness.²

The result for Green OA is also interesting in the context of the common attitude that the final, published version is the only one with value. Our findings suggest that that doesn’t matter to people who don’t have access to that version. Here we’re seeing that Green OA achieves a higher citation rate than the Gold/Bronze/Diamond forms of OA and that almost-double average compared to closed articles. Remember that what we’re counting as Green has been published in a closed journal, it’s just that a free version has been made available. You can still cite the published version even if all you’ve had access to is a free version. And that’s the heart of it here: I’m not going to cite something at all if I couldn’t read it.

None of this is rocket science but it’s the first time we’ve had evidence that is specific to our university and the New Zealand university sector as a whole.

No doubt, after reading the above, Otago researchers will be clamouring to deposit their closed access research in OUR Archive. We’ll look at the practicalities of that in tomorrow’s post, a guest post from the wonderful folks in our Research Support Unit.

Richard White is the Manager, Copyright and Open Access at the University of Otago.

This is one of a series of posts for Open Access week 2019. The comments can be used below for discussion or debate. Otago staff can refer to our Open Access Policy and associated Guidelines.

Notes

For the national results of the research referred to here, including an infographic and full report, refer to the Universities New Zealand website for:

¹ See a fuller discussion of this in our full report, cited immediately above, pp. 9-10.

² The Leiden Ranking tool uses a different method to that employed by our group, including using data from 2014-17, but is a useful tool to evaluate global trends and compare its results to our own. Leiden’s figure for the proportion of NZ research that is openly available in some form is 38.4%, close to what our research found at 41% nationally and 39% for Otago. Leiden’s NZ figure of 38.4% compares to Canada 42%, Australia 42%, Germany 48%, Ireland 49%, Norway 54%, United States 54%, and United Kingdom 71%. 34 of the top 50 universities for proportion of OA research are from the UK; New Zealand’s top-ranked university is the University of Canterbury at number 416 in the list.

What does it cost to be open? Sometimes a lot, sometimes nothing (Open Access Week 2019)

Monday, October 21st, 2019 | Richard White | No Comments

When I talk to researchers about open access, cost is often the first thing that comes up. We know that researchers are in principle overwhelmingly in favour of their work being free to read (with 87% in a large survey backing open as default)¹ but, as we saw yesterday our practice in making our work open is hugely at odds with this since 39% of Otago-authored articles are openly accessible. Cost is definitely one barrier but lack of understanding of the scholarly publishing ecosystem is just as much a factor. Today’s post looks at these issues – it’s going to get detailed further down, so buckle up.

The short version is: we pay a lot for subscription access still and a not-insignificant amount on top of that for open access publications but we could be doing a lot more to make our work open in other, cheaper ways that are just as good (if not better).

The longer version? Here we go.

Most readers will know that publishers charge us subscription fees for access to research. This is still how we get access to most electronic material we use in teaching and research. In 2017 New Zealand universities combined spent $68.5 million on access to electronic resources and this goes up each year.² Open access came along but in some of its models this actually introduced a new cost, where publishers charge the authors/researchers to make it open as opposed to libraries (with fees known as Article Processing Charges or APCs). As I said yesterday that’s where our work estimated $735,000 spent by Otago researchers in 2017.³ The figure for the eight universities combined was $2.1 million so Otago’s share was about one-third.

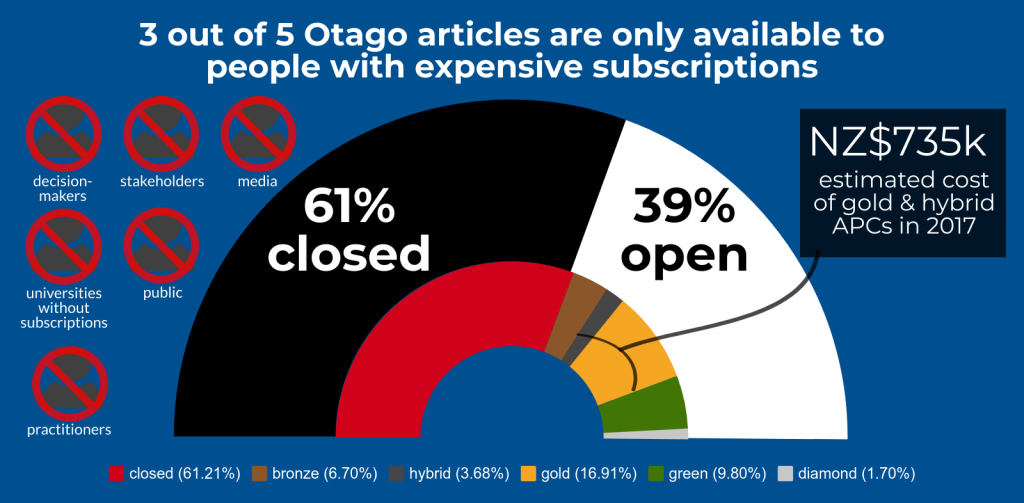
This estimated $735k was spent for two types of open access, as indicated by the black line with the curved line at the end of it. The vast majority of this money was for what are termed Gold OA journals, where there is no subscription fee and all articles are open access with an APC charged to the authors (about $642k or 87% of the total), like Public Library of Science or Biomed Central. The remainder was in Hybrid journals, which charge libraries subscriptions but allow researchers the option of paying an APC to open up that particular article to all readers (e.g. the Lancet, Nature). This is an area of interest for further investigation: why did our researchers choose to publish in these venues and pay this fee, especially where it was optional in the Hybrid cases?

But there are other ways to make your work open. There are several different ‘shades’, as indicated in the smaller arch in the graphic,⁴ but the Green OA proportion is of particular interest because there are no APCs. My title for this post was deliberately provocative and not strictly true: it’s doesn’t cost ‘nothing’ to self-archive in that it requires time and effort to do it and repositories must be developed and maintained. But it’s much cheaper at scale than paying publishers $3000 to $4000 on average per article, with one piece of work identifying the cost per-article of depositing in a repository to be NZ$62.⁵

Most publisher policies now allow you to deposit an accepted manuscript in a non-commercial repository, sometimes with the proviso that you have to wait for a period after publication, most commonly 12 months. (Note: you can actually check the policy of any journal here). The figure on the right here shows what we could have deposited perfectly legally in a repository but haven’t:

People don’t realise they can do this or they don’t feel it’s worth the time and effort to do so. But they likely also don’t understand that on average there appears to be a big advantage in self-archiving your work in terms of impact, which is the subject of tomorrow’s post for OA Week 2019.

Richard White is the Manager, Copyright and Open Access at the University of Otago.

This is one of a series of posts for Open Access week 2019. The comments can be used below for discussion or debate. Otago staff can refer to our Open Access Policy and associated Guidelines.

Notes

For the national results of the research referred to here, including an infographic and full report, refer to the Universities New Zealand website for:

¹ Blankstein, M., & Wolff-Eisenberg, C. (2019, April 12). Ithaka S+R US Faculty Survey 2018. doi: 10.18665/sr.311199

² The Consortium of New Zealand University Libraries reported that subscription to electronic content in 2017 cost universities NZ$68.5 million. See the Universities NZ submission to the Copyright Act review p. 28. For context the Marsden Fund gave out  $84.6 million (Source: Royal Society).

³ This estimate is an estimate because, while we know how many 2017 articles were published where the corresponding author was an Otago researcher in a journal that would require an APC to be paid, we don’t know for sure if that fee was waived or paid by someone else.

⁴ Getting into the minute detail, we can break down the white 39% open section in the graph above into sub-groups to show how the articles were made open. The largest proportion was for Gold OA (16.91% of all articles); next comes Green OA at just under 10% (sometimes called self-archiving, where articles are published in a closed journal but an accepted manuscript version is deposited in a repository like OUR Archive); Bronze OA (6.7%) is where the article is currently freely available but it’s status is uncertain and could change; Hybrid (optional APC) and Diamond (free to publish, free to read) made up the remainder.

⁵ Johnson, R., Pinfield, S., & Fosci, M. (2016). Business process costs of implementing “gold” and “green” open access in institutional and national contexts. Journal of the Association for Information Science and Technology, 67(9), 2283-2295. doi.org/10.1002/asi.23545

How many of Otago’s research articles are free-to-read on the web? (Open Access week 2019)

Sunday, October 20th, 2019 | Richard White | No Comments

How many of Otago’s research articles are free-to-read on the web? Not as many as you would hope.


‘Access provided by the University of Otago’: when you’re reading an online article how often do you notice that little piece of text at the top of the screen? It’s ubiquitous (and tiny) so we hardly notice it but, of course, we can read most of the research we’re interested in because we’re paying for access. The University of Otago has a very high level of access compared to many other teaching or research organisations – not to mention all the decision-makers in government or local bodies, practitioners, business/innovators, media, iwi groups and other stakeholders and the general public who have little or no access to a lot of research publications.

So how much of Otago’s own research is free-to-read online for those who are interested in it? This is something we haven’t had a good idea about – until now. You can see from the above that 3 out of every 5 (61%) are only available to those who can afford to pay for access. This finding comes from a national project looking at the current state of open access in New Zealand, the results¹ of which I’ll be blogging about over the course of Open Access week (21 – 25 October 2019). Out of the 2418 journal articles in our sample published in 2017 by Otago researchers, 938 were online for anyone to read for free (39% or, roughly, 2 out of 5).² The other 1480 papers were only available via a subscription, meaning all those groups I listed above generally won’t have access.

We’re interested in knowing how much of our work can be accessed without barriers because we know that this benefits us not only in scholarly terms but also because it can benefit the wider impact of our work outside of academia. But we’re also interested in how we made our work open and whether it cost extra to do so: that’s the estimated $735,000 in the callout box on the right spent by Otago researchers in 2017 on what are termed Hybrid and Gold open access journals. More on these interesting questions in tomorrow’s post!

Richard White is the Manager, Copyright and Open Access at the University of Otago.

This is one of a series of posts for Open Access week 2019. The comments can be used below for discussion or debate. Otago staff can refer to our Open Access Policy and associated Guidelines.

Notes

¹ For the national results of this work, including an infographic and full report, refer to the Universities New Zealand website for:

² This study used a dataset comprising all the journal articles published by the eight New Zealand universities in 2017 with a Digital Object Identifier (DOI). The graphic and data discussed in this post represent a subset that had at least one Otago author on the paper.

Nature: Data sharing and how it can benefit your scientific career

Wednesday, May 15th, 2019 | Richard White | No Comments

Nature has published a feature article that provides good overview of the current state of data publication and sharing in science. Despite the title, which suggests evangelism in favour of open access, it’s a generally well-balanced view of the challenges facing us right now:

“…the current state of science: partly open, partly closed, and with unclear and inconsistent policies and expectations on data sharing that are still in flux.”

Popkin, Gabriel. Nature 569, 445-447 (2019) doi: 10.1038/d41586-019-01506-x