
Open research has more impact (Open Access Week 2019)
So far this Open Access Week, there’s a chance I’ve depressed readers of this blog. “2 out of 5 Otago articles are free-to-read?” I hear you moan. “Access to research costs us how much?!?” you wail. But I did suggest that there are reasons to be positive.
Open access is often framed as being the right thing to do: the public paid for it so they should have access. That’s not my focus here and the research I’ve been discussing this week sought to look for measurable ways in which we can assess the effect that making your work open has on its impact.
Increasingly the agencies that fund our work are looking at impact, in particular with a new focus on impact outside academia (see MBIE’s recent position paper on research impact). Research that is referenced by policymakers and the media is more likely to have real-world outcomes than research that is cited only by the academic community. In our sample we found that open articles were cited in the media 3.5 times more than closed ones and mentioned in policy documents twice as often.¹
Another, more traditional, way to asses this is our old favourite academic citation rates.
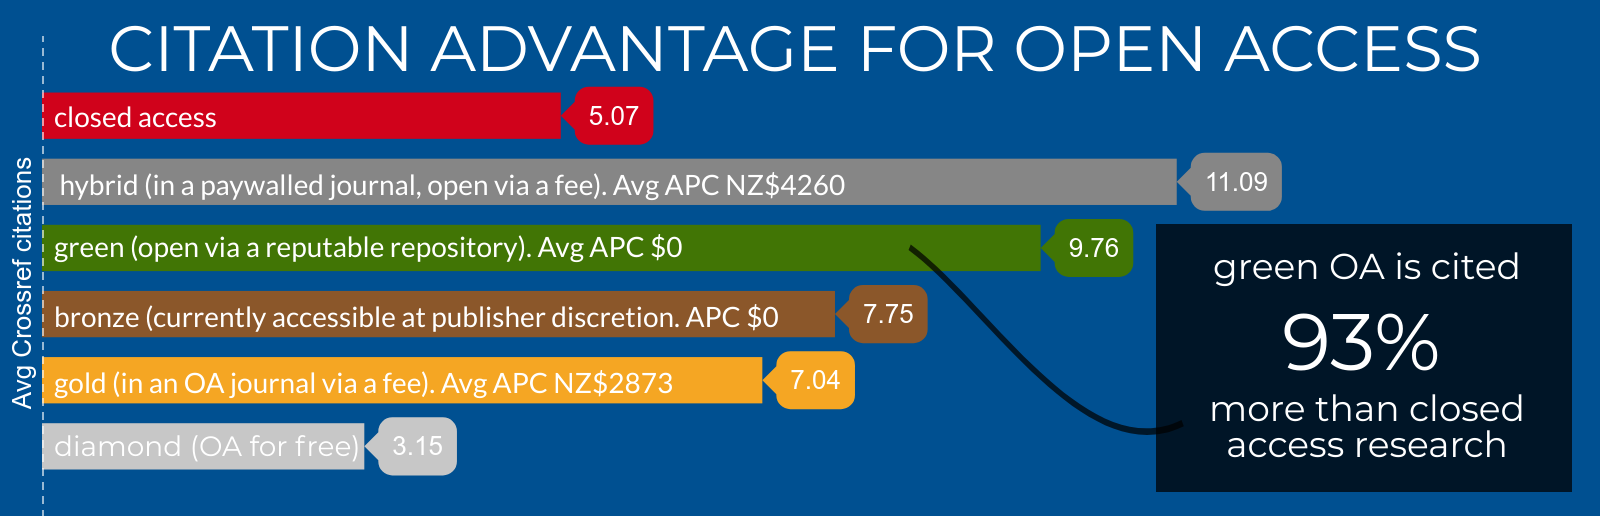
Let’s examine the graph in some detail.
- Closed access articles (n=1480) – that is, those available only via subscription – fare worse than all the types of open access apart from the bottom one (Diamond).
- Hybrid articles (n=89) – those in subscription journals where you have the option of paying for your single article to be open – achieve the highest average. This result is not surprising as they are likely to be high-profile publications (a topic for further investigation for us). It comes at a cost, with the average Article Processing Charge (APC) being $4260 and totaling $93,000 in 2017.
- Green OA (n=237) – self-archiving or repository-deposited work – is almost on a par with Hybrid. Self-archiving incurs no APC, of course, and its average citation rate in our Otago sample is 93% higher than closed research (compared to a 66% advantage for all New Zealand universities).
- Bronze articles (n=162) – those articles whose open status is uncertain but are currently free-to-read – and Gold have similar average citation rates. Gold cost us an estimated $643,000 dollars at an average APC of $2873.
- Diamond journals are those in which is free to publish and free to read. These represent a small subset of our data (n=41) and are mostly small, independent journals.
The Green result is most interesting in the context of yesterday’s discussion, where we saw that we could be depositing the majority of our closed research in repositories, avoiding APCs. But we are not and thus we’re missing out on the citation advantage we see for Green OA here. To compound this, we’re missing out compared to other countries we would normally like to compare ourselves to, which have much higher rates of openness.²
The result for Green OA is also interesting in the context of the common attitude that the final, published version is the only one with value. Our findings suggest that that doesn’t matter to people who don’t have access to that version. Here we’re seeing that Green OA achieves a higher citation rate than the Gold/Bronze/Diamond forms of OA and that almost-double average compared to closed articles. Remember that what we’re counting as Green has been published in a closed journal, it’s just that a free version has been made available. You can still cite the published version even if all you’ve had access to is a free version. And that’s the heart of it here: I’m not going to cite something at all if I couldn’t read it.
None of this is rocket science but it’s the first time we’ve had evidence that is specific to our university and the New Zealand university sector as a whole.
No doubt, after reading the above, Otago researchers will be clamouring to deposit their closed access research in OUR Archive. We’ll look at the practicalities of that in tomorrow’s post, a guest post from the wonderful folks in our Research Support Unit.
Richard White is the Manager, Copyright and Open Access at the University of Otago.
This is one of a series of posts for Open Access week 2019. The comments can be used below for discussion or debate. Otago staff can refer to our Open Access Policy and associated Guidelines.
Notes
For the national results of the research referred to here, including an infographic and full report, refer to the Universities New Zealand website for:
- Infographic: CONZUL OA Project Group (June 2019). NZ open access: what do we know?
- Full report: CONZUL OA Project Group (August 2019). Open Access in New Zealand universities: an environmental scan.
¹ See a fuller discussion of this in our full report, cited immediately above, pp. 9-10.
² The Leiden Ranking tool uses a different method to that employed by our group, including using data from 2014-17, but is a useful tool to evaluate global trends and compare its results to our own. Leiden’s figure for the proportion of NZ research that is openly available in some form is 38.4%, close to what our research found at 41% nationally and 39% for Otago. Leiden’s NZ figure of 38.4% compares to Canada 42%, Australia 42%, Germany 48%, Ireland 49%, Norway 54%, United States 54%, and United Kingdom 71%. 34 of the top 50 universities for proportion of OA research are from the UK; New Zealand’s top-ranked university is the University of Canterbury at number 416 in the list.