
Associate Professor Nick Wilson, Professor Tony Blakely, Dr Cristina Cleghorn, Dr Nisha Nair
 We recently did a blog post on dietary salt and health, particularly with regard to a new large prospective study (the PURE Study). This facilitated useful feedback from others, along with input from colleagues in a journal club we ran. Based on these discussions, we now have stronger concerns about remaining reverse causation in the PURE Study (and persisting concerns regarding other aspects). Here we update some of our thinking and conclude that the totality of the available evidence is sufficient for health authorities to continue taking a range of evidence-based actions to reduce the hazard of high salt intakes. Again however we invite critical comment on our assessment and suggestions on where to from here.
The new observational study – the PURE Study by O’Donnell et al – was the focus of the former blog post. Although it was large multi-country study, it is vital to place the PURE Study in context and consider the total body of evidence around salt intake. And not just in terms of quantity, but also quality.
In our previous blog post we alluded to the overall evidence around salt being harmful to health – and undoubtedly so at high levels. Additionally, our colleagues have also emphasised that the evidence from randomised controlled trials should be weighted more heavily than the results of the PURE Study by itself. We agree with this, and highlight the following key findings from randomised trial data that preceded the PURE Study:
- The randomised trial data show that reducing dietary sodium reduces blood pressure (e.g., a meta-analysis of 34 trials lasting more than 4 weeks (1)).
- The randomised trial data show that reducing blood pressure reduces disease outcomes (e.g., a meta-analysis of 147 randomised trials (2)).
- Long-term follow-up of the randomised trial data around reducing sodium intakes provides some of the strongest scientific evidence available. E.g., the TOHP study followed up their participants for 10-15 years and used relatively reliable methods for measuring sodium (averaging 3 to 7 twenty-four hour urinary excretions of sodium and potassium per subject). It found the “risk of a cardiovascular event was 25% lower among those in the intervention group” (relative risk 0.75, 95% confidence interval 0.57 to 0.99, p=0.04) [3]. Similarly for low levels of sodium intake: “Spline curves supported a linear association of sodium with cardiovascular events, which continued to decrease from 3600 to 2300 and 1500 mg/d” (4). (That is, a linear dose-response (not a U-shaped curve) of CVD risk down to sodium intakes way below the nadir found in the O’Donnell et al PURE Study.) Furthermore, CVD risk was particularly elevated when the sodium to potassium excretion ratio was high (RR, 1.24; 95%CI, 1.05-1.46; p=0.01) (5).
Further thoughts on the limitations with the “PURE” Study
1. Our discussions with colleagues also generated more in-depth discussion on the limitations of the PURE Study: As noted previously the authors of the PURE Study used spot urine measures (and only a single measure) rather than the gold standard of 24-hour urines to measure sodium (see also this systematic review of 20 studies (6)). Our colleagues reiterated the limitations with this measure (though we still doubt that this potential source of measurement error could contribute to the U-shaped relationship found in the PURE Study).
2. Limitations with the Kawasaki formula used in the PURE Study to estimate 24-hour sodium intake from spot urines – in particular with this potentially causing substantial over-estimates in sodium intake in the PURE Study (see comments by Professor Bruce Neal in the “Comments” part of the previous blog post). Again, though, we struggle to see how this formula could generate a spurious U-shape curve – possible, but unlikely.
3. “Reverse causation cannot be completely ruled out” as the PURE authors’ state. Reverse causation would arise if early CVD or other diseases caused a lowering of salt intake or excretion. The authors did adjust in their analyses for various known diseases and certain risk factors, and exclude CVD events in the first two years post-diagnosis in sensitivity analyses (although this greatly reduced the number of events given only a median 3.7 year follow-up). If these adjustments and exclusion were inadequate to completely rule out reverse causation, it could be that undiagnosed pathological processes were reducing their sodium excretion and contributing to the higher death rate in this group (the left side of the reported U-shaped association) or that medications were reducing sodium intake. Indeed, the PURE Study reports that the group found to have the lowest sodium excretion also had the highest: LDL levels, prevalence of a history of CVD, prevalence of diabetes, alcohol intake and medication use for each of 4 types of CVD medication (other differences were the lowest male to female ratio and highest calorie intake which may also be relevant; see Table 1 of O’Donnell et al). It is our view, now, that reverse causation is the most likely spurious cause of a U-shaped association. One way to resolve this is with longer follow-up of the PURE Study – which is frustrating in that we are now waiting another five years or so for a more definitive answer.
4. Residual confounding remains a possibility – although it would probably take a mis-measured or mis-specified confounder with a U-Shape association with CVD risk and a linear association with sodium intake to generate such a pattern. Such a situation would normally be unlikely…. but BMI does have a U-shape association with CVD risk in many studies. The PURE Study adjusted for BMI, but we suspect as a linear term rather than categorical or non-linear (it is not clear in the paper) which could generate some spurious U-shape association of sodium with CVD risk. We consider this residual source of error as possible, but (as best we can tell) probably not as important as the above reverse causation concern.
Collectively these limitations should raise suggestions that the various findings from the PURE Study (no harm until very high sodium intakes and a U-shaped relationship) should be treated cautiously and seen as less important that the randomised trial evidence detailed above.
Where to from here?
1. Watch for the inevitable correspondence regarding this paper in the NEJM that addresses the above concerns, and any other arising critiques.
2. Wait for longer follow-up of the PURE Study – although this is not that helpful for policy-makers now! Alternatively, we could wait until the large cluster-randomised trial in China is completed (7).
3. Although many public health and nutritional scientists may be reassured by the overall state of the evidence – we suspect that some policy makers might not be. Therefore there might still be a case for the World Health Organization (WHO) to establish a high-level review panel and re-clarify the state of the evidence and the future research agenda (as we suggested previously). Such a panel may have maximum credibility if it just had scientists with no past publications relating to dietary salt and health.
4. In the meantime public health policy is, we believe justified to continue with sodium reduction actions that target the high end of the salt intake spectrum and are unlikely to impact on those with very low salt intake. These include:
i) Regulations on setting maximum levels of sodium in the very saltiest of foods e.g., sauces and processed meats. This may also encourage more manufacturers to replace sodium with potassium (NaCl with KCl) in these products (see this recent meta-analysis of 5 RCTs using salt substitutes and the benefits for lowering blood pressure (8)).
ii) Improving front of pack nutrition labelling – e.g., traffic light type systems, or the “warning high salt” style of label used in Finland (9).
iii) Encouraging the food industry to reformulate their processed foods (possibly one of the reasons for the success of a recent UK salt reduction campaign (10)). Indeed, this is a focus for the Heart Foundation in NZ, which had had success with reducing sodium in NZ bread, breakfast cereals and margarine in the past (11). The Foundation is now working with other food manufacturers e.g., Continental products such as soups and spreads (12).
5. Probably justified to consider a wider range of options:
i) A tax on junk food (as recently introduced in Mexico) – which would target foods high in sugar, saturated fat and sodium. Revenue from such a tax could fund nutrition interventions such as healthy school lunches.
ii) A tax on salt itself eg, at the point at which it leaves the salt production facility. Of note is that Hungary has a tax on salty snacks.
iii) Regulations on maximum salt levels in a wide range of foods e.g., as in some European countries (13) and recently South Africa (14).
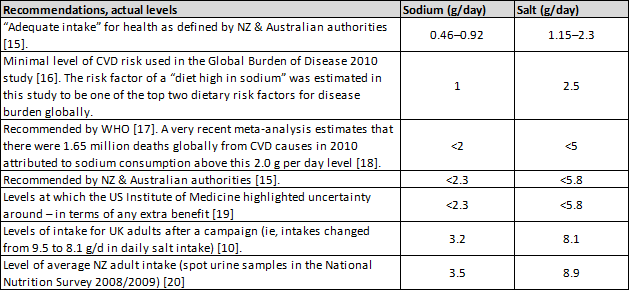
All these options could be considered in the NZ context – given the high levels of intake in this country (see Appendix). In particular reducing population salt intakes would probably be pro-equity given higher background CVD rates among Māori.
Conclusions
It seems that the totality of evidence – and particularly the randomised trial data, suggests it would be beneficial for health authorities to continue acting to reduce dietary salt intakes. Many options exist, from more cautious approaches to bolder ones such as junk food taxes.
Acknowledgements: We thank very much those people who commented on the previous blog and also those who contributed to our multi-agency journal club on the PURE Study.
References
1. He FJ, Li J, Macgregor GA: Effect of longer term modest salt reduction on blood pressure: Cochrane systematic review and meta-analysis of randomised trials. BMJ 2013, 346:f1325.
2. Law MR, Morris JK, Wald NJ: Use of blood pressure lowering drugs in the prevention of cardiovascular disease: meta-analysis of 147 randomised trials in the context of expectations from prospective epidemiological studies. BMJ 2009, 338:b1665.
3. Cook NR, Cutler JA, Obarzanek E, Buring JE, Rexrode KM, Kumanyika SK, Appel LJ, Whelton PK: Long term effects of dietary sodium reduction on cardiovascular disease outcomes: observational follow-up of the trials of hypertension prevention (TOHP). BMJ 2007, 334(7599):885-888.
4. Cook NR, Appel LJ, Whelton PK: Lower levels of sodium intake and reduced cardiovascular risk. Circulation 2014, 129(9):981-989.
5. Cook NR, Obarzanek E, Cutler JA, Buring JE, Rexrode KM, Kumanyika SK, Appel LJ, Whelton PK, Trials of Hypertension Prevention Collaborative Research G: Joint effects of sodium and potassium intake on subsequent cardiovascular disease: the Trials of Hypertension Prevention follow-up study. Archives of Internal Medicine 2009, 169(1):32-40.
6. Ji C, Sykes L, Paul C, Dary O, Legetic B, Campbell NR, Cappuccio FP: Systematic review of studies comparing 24-hour and spot urine collections for estimating population salt intake. Pan American Journal of Public Health 2012, 32(4):307-315.
7. Li N, Yan LL, Niu W, Labarthe D, Feng X, Shi J, Zhang J, Zhang R, Zhang Y, Chu H et al: A large-scale cluster randomized trial to determine the effects of community-based dietary sodium reduction–the China Rural Health Initiative Sodium Reduction Study. American Heart Journal 2013, 166(5):815-822.
8. Peng Y-G, Li W, Wen X-X, Li Y, Hu J-H, Zhao L-C: Effects of salt substitutes on blood pressure: a meta-analysis of randomized controlled trials1-3. The American Journal of Clinical Nutrition 2014, [E-publication 15 October].
9. Pietinen P, Valsta LM, Hirvonen T, Sinkko H: Labelling the salt content in foods: a useful tool in reducing sodium intake in Finland. Public Health Nutr 2008, 11(4):335-340.
10. He FJ, Brinsden HC, Macgregor GA: Salt reduction in the United Kingdom: a successful experiment in public health. J Hum Hypertens [E-publication 31 October] 2013.
11. Young L, Swinburn B: Impact of the Pick the Tick food information programme on the salt content of food in New Zealand. Health Promotion International 2002, 17(1):13-19.
12. Heart Foundation: Case study 3: Unilever. http://www.heartfoundation.org.nz/programmes-resources/food-industry-and-hospitality/heartsafe/case-studies-resources/case-studies/case-study-3-unilever
13. European Commission: Survey on members states implementation of the EU salt reduction framework: Directorate-General Health and Consumers 2012. Available from: http://ec.europa.eu/health/nutrition_physical_activity/docs/salt_report1_en.pdf
14. Hofman K, Tollman S: Population health in South Africa: a view from the salt mines. Lancet Global Health 2013, 1:e66-67.
15. NHMRC/MoH: Nutrient Reference Values for Australia and New Zealand. Canberra, ACT: National Health and Medical Research Council (NHMRC); New Zealand Ministry of Health (MoH), 2006. http://www.nhmrc.gov.au; http://www.moh.govt.nz/publications
16. Lim SS, Vos T, Flaxman AD, Danaei G, Shibuya K, Adair-Rohani H, Amann M, Anderson HR, Andrews KG, Aryee M et al: A comparative risk assessment of burden of disease and injury attributable to 67 risk factors and risk factor clusters in 21 regions, 1990-2010: a systematic analysis for the Global Burden of Disease Study 2010. Lancet 2012, 380(9859):2224-2260.
17. WHO: Guideline: Sodium intake for adults and children. Geneva, World Health Organization (WHO). http://www.who.int/nutrition/publications/guidelines/sodium_intake_printversion.pdf
18. Mozaffarian D, Fahimi S, Singh GM, Micha R, Khatibzadeh S, Engell RE, Lim S, Danaei G, Ezzati M, Powles J et al: Global sodium consumption and death from cardiovascular causes. The New England Journal of Medicine 2014, 371(7):624-634.
19. Institute of Medicine: Sodium Intake in Populations: Assessment of Evidence. Washington, DC: The National Academies Press, 2013. http://www.nap.edu/catalog.php?record_id=18311;
20. McLean R, Williams S, Mann J, Parnell W: How much salt are we eating? Estimates of New Zealand population sodium from the 2008/2009 Adult Nutrition Survey [Presentation on 2 December 2011]. Joint Annual Scientific Meeting of the Australian and New Zealand Nutrition Societies. Queenstown, New Zealand (29 November – 2 December); 2011.
Thanks for your highly interesting comments (the same with the previous post).
Recently, the authors of the PURE study published an article in Journal of Hypertension, regarding the validity of their estimated 24 hour sodium excretion. http://www.ncbi.nlm.nih.gov/pubmed/24569420
However, a critical comment to this study has just been published, where the authors point out that the PURE authors …
(see http://journals.lww.com/jhypertension/Citation/2014/12000/Can_sodium_excretion_from_single_fasting_morning.31.aspx).
They also cite studies showing that the intra-individual sodium excretion fluctuates with an infradian pattern, which means that a single 24-hr urine sample may not reflect usual intake.
As far as I know, there are very few studies on salt that have applied multiple 24 hr urine collections, TOHP is one of them.
We are pleased to see the very well balanced further commentary on the ‘salt saga’. It has been a rewarding process of discussion and review of a paper that apparently challenges the wisdom current nutritional guidelines, but when examined more closely and considered in the totality of the evidence, is not so convincing.
With regard to the need for a further committee of WHO we would point out that the WHO Nutrition Guidance Advisory Group (NUGAG) (of which Jim Mann and Murray Skeaff are members) has a brief along the lines suggested. The NUGAG Subgroup on Diet and Health has a focus on maintaining currency of the dietary goals for the prevention of obesity and diet-related non-communicable diseases. Membership of NUGAG includes people with a broad interest in public health nutrition, and several members have epiemiological and clinical trial expertise. NUGAG recommendations are further vetted by the WHO Guidelines Review Committee with overall expertise in guideline development.
NUGAG was responsible for developing the current WHO guideline on Sodium intake for adults and children (published in 2012) based on a series of systematic reviews and meta analyses and consultation with a range of individuals with additional expertise. This guideline is due to be reviewed by the end of 2017, however if a large amount of new evidence becomes available before that date, the guideline review groups may be convened prior to 2017.
Rachael McLean
Lisa Te Morenga
Jim Mann
Murray Skeaff
Thanks for your comments Rachael, Lisa, Jim and Murray. And the notification of the NUGAG remit and timeline.
Tony