
Technology Enhanced Learning. eLearning. Educational Technology – this is a field that is so filled with buzzwords we have trouble deciding what to call ourselves.
One emerging field that some might consider a buzzword is Learning Analytics. Simply put, learning analytics is the practice of analysing data from student interactions with online learning material in order to infer information about student learning. A simple example might be looking at the number of times students click on a link to a particular learning activity as a measure of student engagement. Another example might be looking at proportion of students in a cohort who engage in a series of weekly activities – a decrease over time might be inferred to be a decrease in engagement with learning.
Why do we want to look at this? There’s no point if we don’t act on our observations. The problem is knowing how to act, when we don’t always know what the pattern we’re observing means. A large number of clicks on a particular resource might mean that it is extremely valuable and worth revisiting – another interpretation might be that the resource is confusing and students are going back to it time and again because they don’t understand it. Similarly, a decrease in the proportion of clicks over time might reflect decreasing educational quality of the resources, or it might mean a decrease in students’ available time to work on self-directed learning.
At an institutional level, some of the problems with the interpretation side of analytics can be dealt with by aggregating data from numerous sources (e.g., Moodle clicks and assessment results), however this requires an infrastructure that is designed to share and pool data so that it can be analysed coherently. This is not always a simple task.
As a teacher, what can you do? If you use Moodle, one thing you can do is use the reports in your moodle course to look at what students are doing (or not doing). Click on ‘Reports’ under your administration block will show a number of views of student data. The most useful at an initial level are ‘Activity Report’, which shows the number of clicks on each resource in your course, and ‘Course Participation’, which will let you see the number of interactions with a learning resource over a specified time period.
If you use Blackboard, you can check out several different reports to see how your students are doing as well. Click on ‘Evaluation’ under Course Management, and then click ‘Course Reports’ to see all of the report options available to you. Try ‘All User Activity’ and ‘Course Activity’ to get an initial idea of what students are looking at and how much time students are spending on average in your course.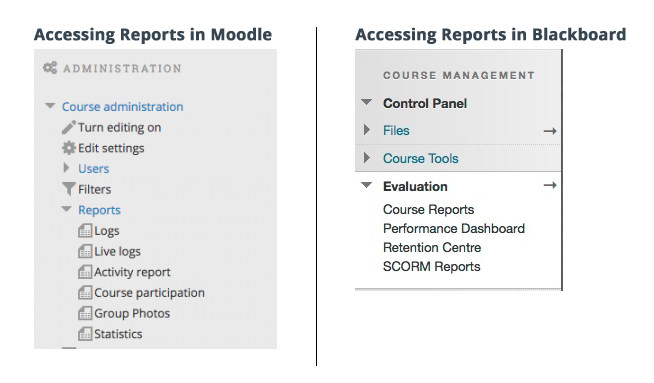
These simple tools can help you identify popular activities in your course, and in some cases identify students who might not be engaging with the resources and therefore might need some support. Depending on the inferences you draw, it might mean there are learning activities that need to be redesigned or changed in order to make them more valuable to students. The best thing to do if you see a potentially problematic pattern is to go and talk to your students and find out what’s really going on.
There are numerous potential ethical issues with using this kind of data, and it is helpful if students are informed that you intend to look at their data in this way if you plan to do it. Be aware, though, of the ‘digital Hawthorne effect’ that might emerge, where students’ recorded interactions increase simply because they know they are being observed. Also be aware that a click on a resource does not equate to reading, engaging or processing the information that is presented. Nevertheless, looking at this data can be part of a process of evaluating your course material and seeing what is working for students.
For an overview of some of the issues for Health professional Education in this emerging area, Ellaway et al (2014) provide a good analysis and a framework for understanding the role analytics and big data can play.
Workshops on this topic are happening around the country in October. Find out more here: https://www.flexiblelearning.auckland.ac.nz/learning-analytics-roadshow/2.html
