
Optimising PDFs in acrobat pro (including downsampling and compressing rasters)
Sometimes we are required to reduce the file size of a pdf so that it can be uploaded, emailed etc. When we are printing something we always want to use an uncompressed version though.
Some concepts
There are a couple of key concepts that are useful to understand when reducing the file size of a pdf. Usually vector text graphics etc. take up a small proportion of the pdf file size and the thing that makes pdfs large are embedded rasters (aka bitmaps, images) such as photos. To make these rasters smaller we can do two things to them.
1 Downsampling
This is the process of reducing the number of pixels in an image. Typically downsampling will be achieved by choosing a lower pixel density (PPI) such as 150ppi rather than 300ppi. This will result in a squared reduction in file size. For example if you downsample from 300 to 100ppi the new file will be ¼ the size of the original. You might choose to downsample an image if you don’t expect someone to view it at a high pixel density (i.e. for images that will only be viewed on screen).
2 Raster compression
This is the process of storing the information about an image more efficiently. Compression falls into two categories: lossy and lossless and there are a variety of file types that utilize different compression algorithms. Jpeg compression is lossy and stores information about how the colours change from one corner of an 8×8 pixel square to the other corner (if you look closely at highly compressed JPEGs you can see this effect . Sometimes compression is used generally to refer to any kind of activity that will reduce the file size, I will use raster compression to explicitly refer to the compression to a raster image not including downsampling.
More concepts
For a bit of background check out the blog post I did about pixel count resolution etc.
The quick and dirty method: saving as reduced size pdf from acrobat pro
This is a bit of a mystery approach. I’ve looked into it and I cannot figure out what this actually does to the rasters. Sometimes this works ok. This is the quick and dirty approach.
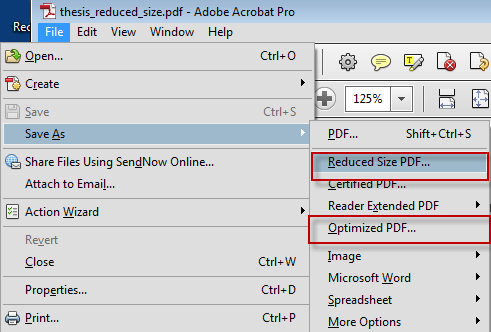
Save as options from Acrobat pro
The better approach: save as optimising pdf
Saving as optimised pdf gives you a lot more options including the ability to see what is taking up space in your pdf (Click on Save as> Optimized PDF>Audit space usage).
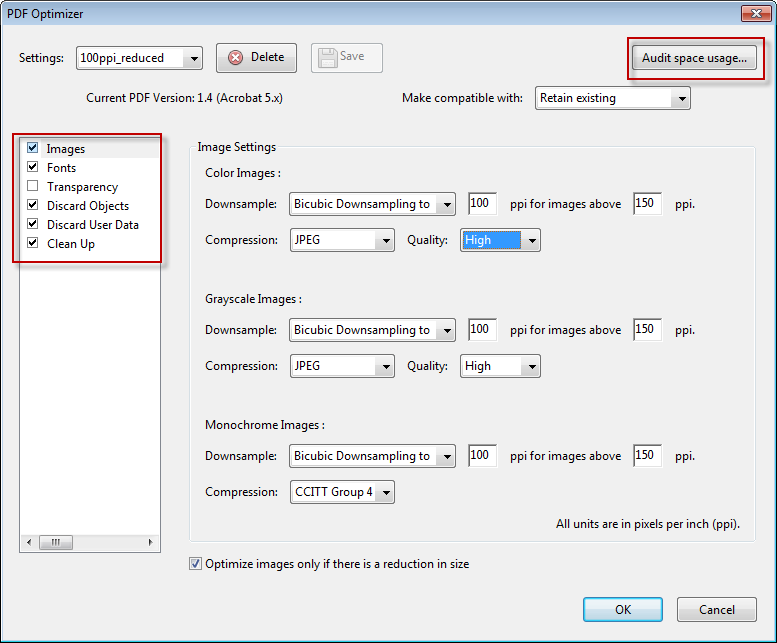
Pdf optimiser options. Each of the boxes on the left hand side are submenus.
Clicking on audit space usage will bring up a box listing the size and percentage for each element in your pdf. In the example below there are three main contributors to the large file size:
- Images
- X-object Forms: the vector graphics in the document
- Piece information: In the case of this document this turns out to be information created by the program that made the pdf (LaTeX) and we don’t actually need it.
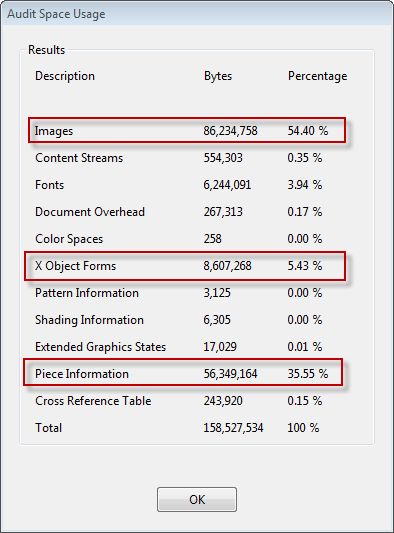
Audit space usage dialog box
We can do stuff to make 1 and 3 Smaller but there’s not much we can do about 2 (in some rare cases rasterising the really complex vector graphics may help).
Other optimising things
Before we start downsampling and compressing the images it’s useful to look at what can be done to the rest of the pdf. I found this useful information out from http://chris-hummersone.blogspot.co.nz/2011/01/how-to-reduce-size-of-your-document.html . Chris’s post deals specifically with pdfs created from LaTex but the principles should be transferable to any pdf.
Below are the settings he recommends for each tab (for more detail read his post).
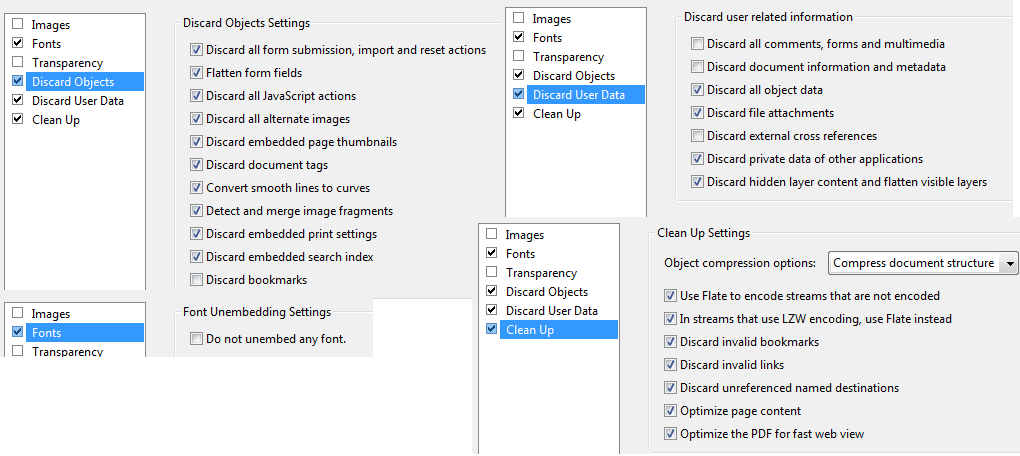
Recommended options for PDF optimising
I recommend saving these settings so you can use them again. In the example above where piece information contributed ~50MB the file size was reduce by approximately 50MB.
Image downsampling and raster compression
The amount of downsampling and raster compression that you choose to use is going to depend on the purpose for the document. The lower limit I would go to is bicubic downsampling to 100ppi for all image types and JPEG at high quality. This should produce a much smaller pdf for viewing on a computer (e.g. 20MB vs. 150MB). You may want to save various configurations for downsampling and compressing that are fit for different purposes.
Do not do any compression to the version you want to print. Print is much higher resolution than on screen and any compression is much more noticeable.
Some notes on saving PDFs with illustrator compatibility and/or embedded images.
I’m not entirely sure if optimising a pdf will get rid of extra images that are stored when pdfs are saved from illustrator with ai compatibility checked and embedded images. See my previous post for information about best saving practices from AI.
Pixel count, pixel density, document size, dots per inch, optical resolution
There are a lot of articles out there on the web that discuss these topics. Although understanding these concepts is inherently a little tricky, the biggest problem is the lack of consistent and unambiguous naming. In this post I will describe what these things are as unambiguously as possible. I find that sometimes its easiest to describe what you mean rather than using these names.
Definitions
Pixel count (aka pixel dimensions, resolution)
The number of pixels in an image may be reported as
- a width * height e.g. 1024*768pixels
- a total number of pixels e.g. for cameras: 2450*3700 = 9065000 Pixels = ~9 Megapixels
Pixel density (aka: digital resolution, resolution)
Often incorrectly referred to as dots per inch (see description for DPI below)
A measure of the density of the pixels in physical space. For example how many pixels in one linear inch (PPI).
This may be reported for screens; for example a 1920*1080 monitor that is 26.7inches across will have a pixel density (resolution) of 1920/26.7 = 72ppi. Note that most monitors with this pixel count are smaller (maybe 23inches) and thus have a pixel density (resolution) higher than 72ppi.
Raster images (e.g. photos) also have a value stored for pixel density (resolution). By default most cameras will set this value to 72ppi.
If you are scanning something than you may choose a resolution for scanning such as 300ppi for documents and 1000ppi for slides. In this case it is most likely that the value stored in the file will be this value.
Document size (aka: image size, presented size)
Not to be confused with image file size (aka: image size) which is the size of the image file i.e. 2.5MB.
Document size is the physical dimensions that an image has (perhaps measured in cm or mm). This is easier to get your head around for printed material where we can just get out a ruler to measure the image size.
For raster images (e.g. photos) on a computer the document size is actually just whatever is calculated using the pixel count and the pixel density.
pixel density = pixel count (in one direction)/ image size (in one direction)
For example if an image is 2400pixels across and has a pixel density of 300ppi than the document size will be 2400/300 = 8 inches = 203.2mm, that’s slightly less than the width of an A4 page.
Dots per inch (aka: printed resolution, dot density)
Printers have limited colours (usually just cyan, magenta, yellow and black). In order to create all the colours and tones for a photo these colours are printed in variable amounts as a dot pattern. If you look closely at a printed page or use a magnifying glass you can see this dot pattern.
The higher the number of dots per inch there is in a printed image the greater the level of detail typically. More dots are required than the pixel count to get the same detail as an image on a screen. Printers will typically print at 300dpi, 720dpi or higher.
Dots per inch is commonly used interchangeably with pixels per inch. This is wrong. Pixels per inch is the correct term for pixel density on a computer and dots per inch is the correct term for printed images.
An image with pixels, shown on left compared to the same image with dots shown on the right
Optical resolution
Optical resolution is a measure of the ability to resolve detail in an image. A simple way to measure this is to imagine the smallest and closest possible objects that can be resolved as two distinct objects.
This is perhaps the least considered aspect of images and image capture (e.g. photography, scanning) and one of the most important. Optical resolution, is perhaps the only true resolution.
While the pixel count sets an upper limit for optical resolution it is generally the optics of the image capture system and in the case of photography the quality of the camera and skill of the photographer that determine the optical resolution.
To understand how pixel count is different to optical resolution let us consider two examples:
- If an image is out of focus then it will have a lower optical resolution than an image in focus that is captured using the same pixel density.
- A slide scanner can capture at 1200ppi, 2400ppi or 4800ppi, however due to the optical resolution limit of the scanner there may be no difference in optical resolution at 4800ppi vs 2400ppi. At 1200ppi the optical resolution of the image captured is lower than at 2400ppi because the pixel density is now the determining factor. See image below.
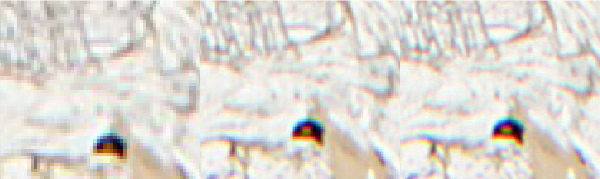
Thin sections scanned at 1200ppi (left), 2400ppi (middle) and 4800ppi(right)
