
Dr Jennifer Summers, Prof Michael Baker, Prof Nick Wilson*
Summers J, Baker M, Wilson N. The Omicron waves – Comparing Aotearoa NZ and Australia in four key graphs. Public Health Expert Blog. 12 April 2022. https://blogs.otago.ac.nz/pubhealthexpert/the-omicron-waves-comparing-aotearoa-nz-and-australia-in-four-key-graphs/
In this blog we explore the first Covid-19 Omicron variant waves in Australia and Aotearoa New Zealand (NZ). We find that Australia’s first Omicron wave resulted in higher hospitalisation and ICU occupancy compared to NZ. However, when examining the Auckland region compared with the rest of NZ, Auckland’s experience of the first Omicron wave is more severe, with a higher hospitalisation rate. We recommend that the NZ Government does more to prepare for a possible second Omicron wave (as in Australia) and for future variants of concern. Priority areas are increasing vaccination coverage and improving mask use and indoor ventilation.

Image by Luke Pilkinton-Ching, University of Otago Wellington
At the same time as the Aotearoa New Zealand (NZ) Government reduces and removes some of the public health measures established to protect New Zealanders from Covid-19, the country is still experiencing its worst nationwide Covid-19 outbreak. This outbreak is almost entirely fuelled by the Omicron variant of Covid-19. When considering potential scenarios for the future of the Covid-19 pandemic (in particular Omicron) in NZ, one of our best examples to look at is Australia.
Australia first identified Omicron at its border just three days after it was first recognized in South Africa in late November 2021, with Australian community cases identified in early December 2021. Whereas for NZ, the first Omicron case at the border occurred in mid-December 2021, with community transmission first reported in mid-January 2022. What followed in both countries after the more highly transmissible Omicron variant spread into the community was a wave of cases on a substantially larger scale than previously experienced in either country during the pandemic. These waves of community cases have also resulted in high numbers of cases requiring hospitalisation and admission to Intensive Care Units (ICU) in both nations.
New case rate of Covid-19
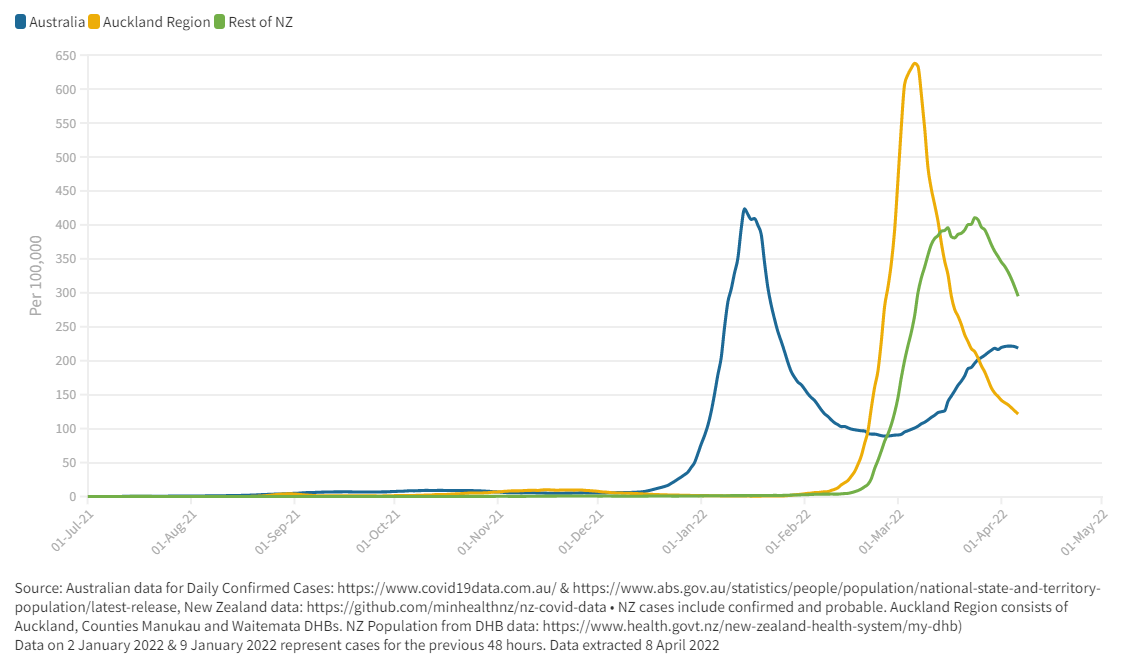
To compare Australia and NZ’s Covid-19 cases, we have used a 7-day average for Covid-19 cases and adjusted the values to rates per 100,000 population (figure 1). Figure 1 covers the period from July 2021 of the Covid-19 pandemic, and is likely a substantial underestimate of the true number of infections as a result of potential false negatives and underreporting of test results due to the increased reliance on individual RATs testing rather PCR at this stage in the pandemic. Australia’s first Omicron wave peaked in mid-January 2022. NZ as a whole generally lags almost two months behind Australia with its first Omicron peak occurring in March 2022. However, when we examine the Auckland region against the rest of NZ, we observe that Auckland experienced its peak in cases in early March 2022 (with the three DHBs peaking on 4 March). The rest of NZ in general lags behind by 1 to 4 weeks (peaking on 22 March overall, with most individual DHBs peaking from 8 to 31 March). Auckland’s peak is also substantially higher than either the rest of NZ or Australia on a per 100,000 population basis. The numbers in Auckland have now fallen to below 2,000 daily cases, and will most likely track downwards for a period. For the rest of NZ, reported cases have been averaging around ~11,000 daily cases, with regional variation in the timing of peaks, and with a slightly more drawn out pandemic wave than that experienced in Australia (although there are state & territory variations to the timing of peaks). What the data also show is that Australia is experiencing its second Omicron wave beginning early March 2022. For South Australia and Tasmania, the number of confirmed cases in the second Omicron wave is higher than the first wave of Omicron.
Figure 1: Seven Day Case Average per 100,000 Population
Hospital occupancy rates
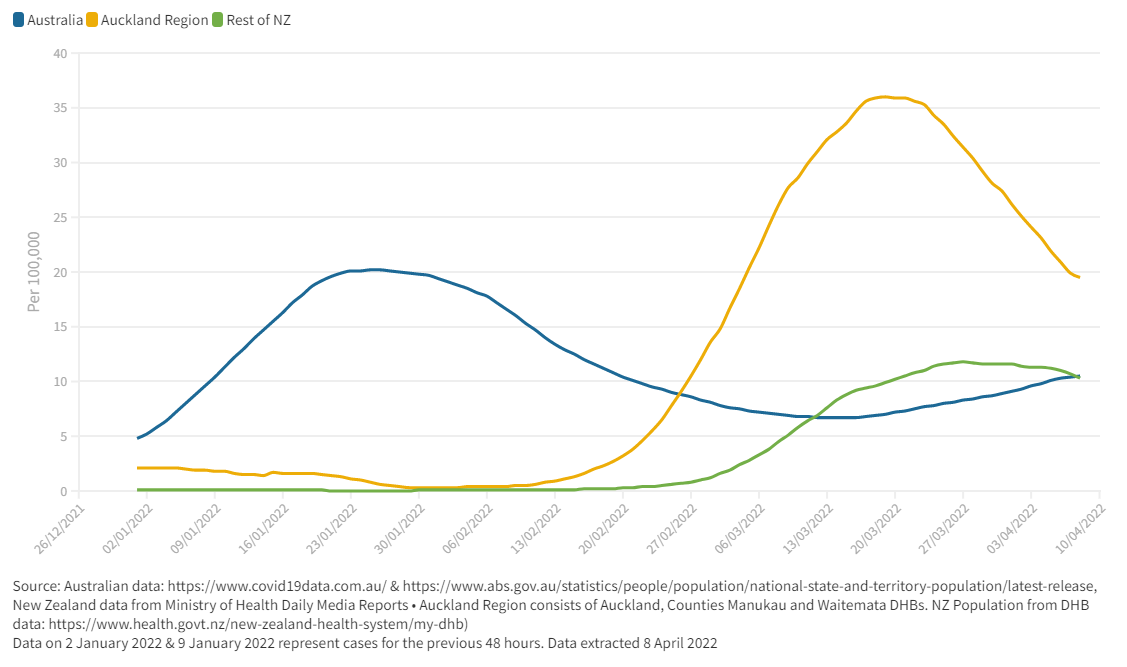
The peak in Australian Covid-19 hospital occupancy during the first Omicron wave occurred on 25 January 2022 with nearly 5,400 cases in hospital. This timing was nearly two weeks after the peak in cases. In NZ, Auckland region’s peak in hospitalisations occurred on mid-March with over 630 in hospital, trailing its peak of cases from nearly two weeks earlier. For the rest of NZ, hospitalisations peaked on 22 March with over 400 in hospital outside of the Auckland region. To compare these hospitalisations for Covid-19 in Australia and NZ (and specifically the Auckland region) we have taken a 7-day average of reported hospitalisations and adjusted to a per 100,000 population rate (figure 2). What we observe here is the notably higher rate of Covid-19 hospitalisations in the Auckland region compared to the rest of NZ, and also Australia. This difference may be due to higher levels of deprivation in Auckland, with both household crowding and higher prevalence of co-morbidities. However, future research is needed to explore this further.
A second Omicron wave of hospitalisations starting from mid-March is also evident for Australia. Our previous estimates using Australian hospitalisation peaks, suggested that on a per capita basis, NZ could expect 1,107 hospitalisations at its peak. However, NZ overall reached a peak in hospitalisations of 1,016 on 22 March 2022, so slightly lower than anticipated in this hypothetical projection we made on 4 February 2022.
Figure 2: Seven Day Hospitalisation Average per 100,000 Population
ICU occupancy rates
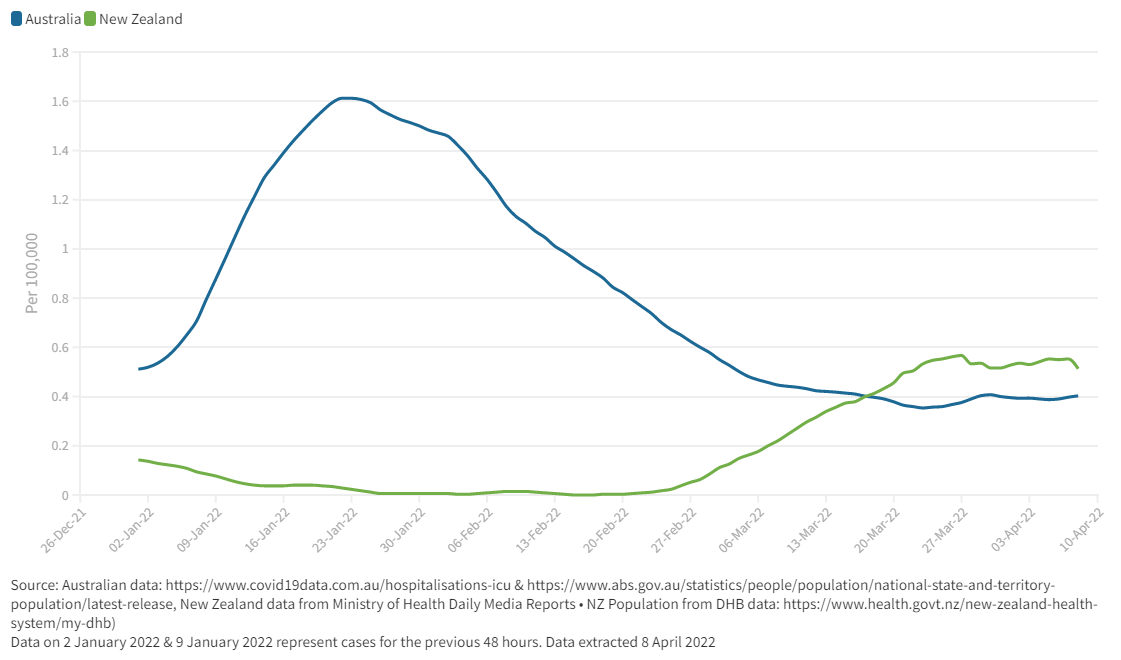
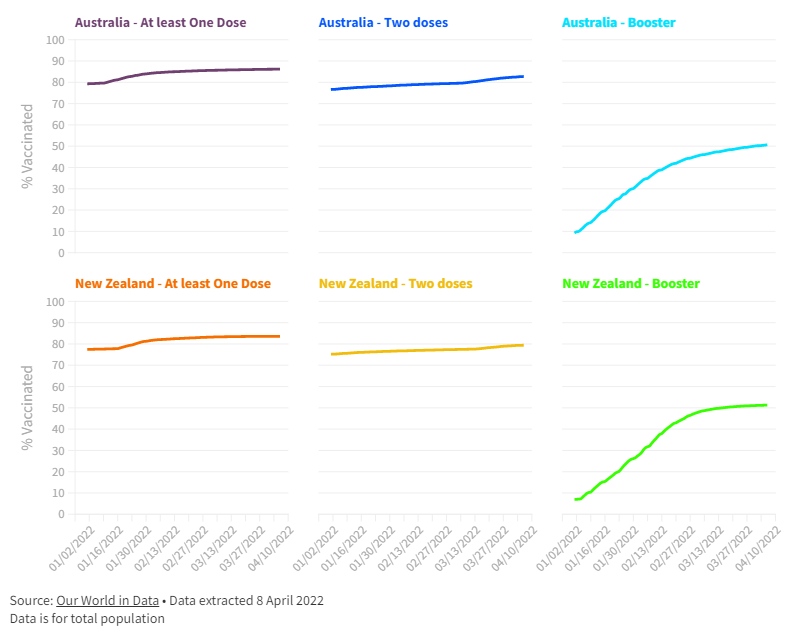
When we examine the ICU occupancy rates between Australia and NZ, it is clear that on a per capita basis, ICU admissions in Australia reached a higher peak than that in NZ (albeit with NZ ICU numbers staying relatively steady in the beginning of April 2022) (figure 3). For Australia, the peak in ICU occupancy occurred on 21 January with 424 ICU beds occupied, while in NZ, the highest occupancy occurred on 21 March with 33 ICU beds occupied. Our previous estimates using Australia’s peak in ICU occupancy suggested that if NZ experienced a per capita equivalent to Australia, NZ could have experienced a peak of 90 in ICU. Fortunately, this case load has not eventuated (to date). At Australia’s peak of Omicron, ~20% of the population had received a booster, while at NZ’s equivalent peak, ~50% of the population had received a booster (appendix figure 1). Given that the booster is known to reduce severe illness from Omicron infection, this factor may partially explain the generally lower hospitalisation and ICU numbers in NZ as a whole compared to Australia during the first Omicron waves. However, to be sure about this explanation, further investigation is needed.
Figure 3: Seven Day ICU Average per 100,000 Population
Covid-19 variants
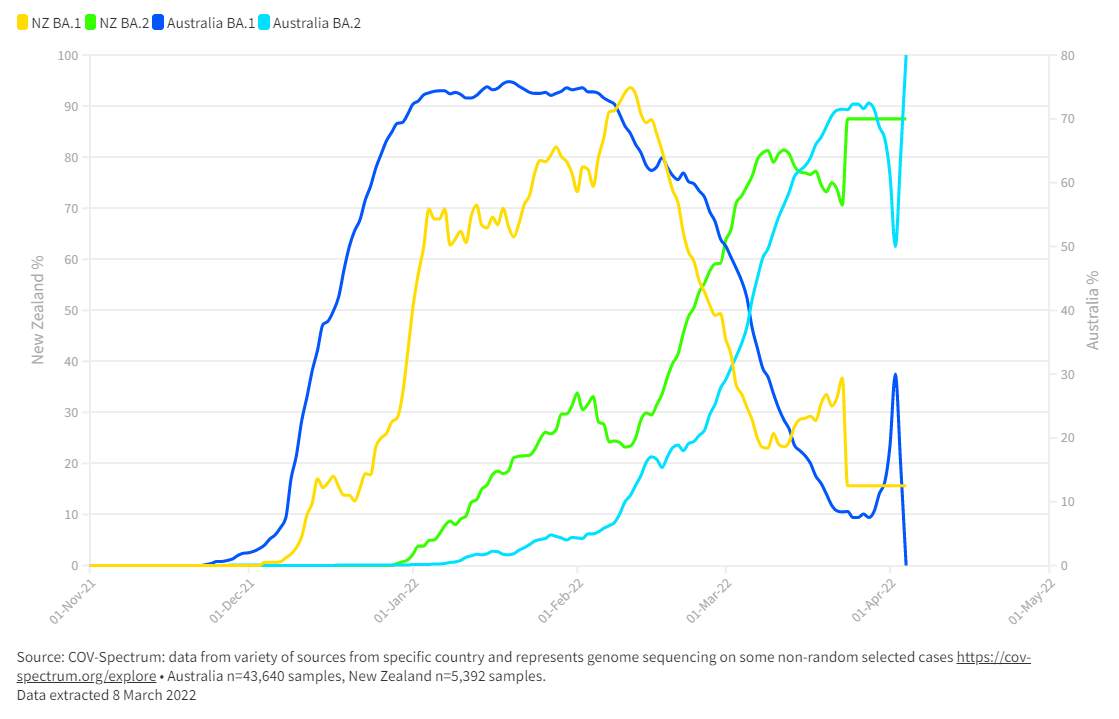
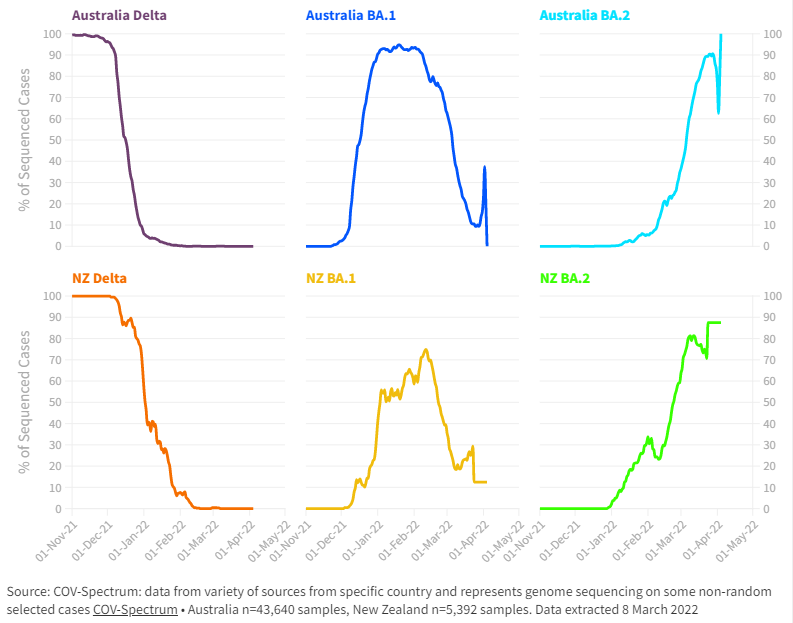
The previously circulating Delta variant in both nations has reduced to minimal levels (it may even be extinct in NZ), with Omicron (and it’s sub-lineages of BA.1 and BA.2) becoming dominant in 2022. For Australia, the first Omicron wave in early 2022 was largely dominated by the Omicron sub-lineage BA.1 (figure 4). However, the more transmissible Omicron sub-lineage of BA.2 has now become the dominant variant in Australia, with recent estimates from CovSpectrum suggesting ~100% of cases may be BA.2. Although at Australia’s peak, BA.1 represented ~93% of cases, ~2% BA.2, and the remainder being the dwindling Delta variant (appendix figure 2). NZ’s experience with the Omicron sub-lineages is somewhat different. The first Omicron peak of confirmed cases in all of NZ was on 7 March 2022 with nearly 24,000 cases. At this time, CovSpectrum suggests that BA.1 was estimated to be only ~20% and BA.2 at ~80%, with negligible Delta cases. By the end of March, BA.2 was even more dominant in NZ, estimated at ~88% prevalence.
Will NZ experience a second Omicron wave?
Second Omicron waves are being experienced in many other nations, such as the United Kingdom, Germany, and Italy, with BA.2 dominating the new wave of cases, just like the current situation in Australia. However, is not clear if the second Omicron waves being experienced internationally (including Australia) is a result of the growing BA.2 dominance, lessening of restrictions (along with increased social interactions) and/or waning immunity. Indeed, given that NZ ‘s first Omicron wave was a mix of both BA.1 and BA.2, the potential for a second wave, or perhaps one as severe as the first Omicron wave, may be somewhat reduced compared to these other countries.
In order to further reduce the impact from the current nationwide Covid-19 outbreak in NZ, and reduce the potential impact from a second Omicron wave (and subsequent waves), we suggest the following immediate steps for the NZ Government:
- Intensify efforts to encourage Covid-19 vaccination of all age groups, with a particular focus on high-risk individuals/communities. This effort should involve continued resourcing of the successful efforts by Māori and Pasifika health service providers.
- Assess the potential benefits of providing a second booster/fourth dose in the Covid-19 vaccination schedule for those at highest risk (as now approved in Australia for higher-risk individuals) to take into account waning immunity, the high transmissibility of BA.2, and to prepare for future variants of concern.
- While the minimum age for a booster has recently been reduced to 16 years of age, it would also be desirable to consider further reducing this minimum age (as recommended by the CDC) along with reducing the time period between child doses. Given the ongoing experience of high transmissibility in NZ’s schools, the Government should be exploring further ways to protect children, such as with a more effective Covid-19 vaccine programme and improvements to the school environment, through ventilation and mask use.
- Make improvements to the quality of masks used and improve enforcement of mask use in indoor public settings. Ventilation upgrades in indoor public settings are also needed.
- Given the upcoming winter period and the potential for a severe influenza season, the NZ Government should further support influenza vaccination nationally. This will help reduce dual demand on the health system from both Covid-19 and seasonal influenza.
- Given the potential for new variants of concern (such as the newly discovered strain XE), the NZ Government should update the Alert Level system so that it is more fit-for-purpose for new challenges. It also needs a surveillance system that identifies if new variants are coming across the border (eg, a system with a special focus on ensuring genomic sequencing of infection in incoming travellers who report illness within two weeks of arrival). Others have highlighted the limits of genome sequencing currently in NZ.
Collectively these actions will strengthen our response to any second Omicron wave (or future variants) and will help with ongoing control of Covid-19 at whatever lower level it plateaus out at.
* Author details: All authors are with the Department of Public Health, University of Otago, Wellington.
Appendix
Appendix Figure 1: Covid-19 Vaccination % Levels in 2022 in NZ and Australia
It seems to me now that ICU is the only data set that can be treated with much confidence. It is likely that standards for admission in Western hospitals are as consistent as anyone could expect.
Cases are now influenced by RAT use, the timing of introduction, the enthusiasm with which the population applied themselves. New Zealanders seemed to leap on them with great enthusiasm on February 24. A factor of 3 was necessary to align the daily case curves from before and after that date.
When the Australian Cases are divided by Hospitalisations from 7 days later, the resulting curve mimics the Case curve. Far fewer people (2 or 3 times) were allowed into Hospital per Case, at the peak. Auckland did not seem to suffer as much distortion. Perhaps we were able to offer a better service – for the same reason our ICU numbers are low.
I think it is arguable that our hospital rates are in truth not higher.
If we compare with NSW and VIC alone, we are very similar – albeit they had higher Delta numbers going in.
Deaths! Well, the raw figures are too blurry. One would expect some correlation with ICU though.
Actually, I have to admit I had not created the graph for Auckland’s Cases to Hospital Beds ratio.
It is moderately peaky , cf the OZ states.
Similar height to South Australia.
The area under the curve is more like a half though, which correlates better with our ICU figures.
Forgive my broken train of thought. It is just how my elves work.
Comparing Auckland and South Australia over 55 days beginning 11 days before their respective case peaks: –
-Auckland has recorded nearly twice as many cases as South Australia. This is nonsense.
-If we then halve Auckland’s overenthusiastic RAT user case numbers and calculate overall respective Case / Hosp Bed ratios: Auckland is 5.7 and South Australia is 10.7
Again this points to Auckland being kinder to its Covid cases, not that we have more severe cases.