
Prof Nick Wilson, Dr Jennifer Summers, Dr Amanda Kvalsvig, Prof Michael Baker*
In this blog we summarise the results of modelling for an Omicron variant outbreak of Covid-19 in NZ by the Institute of Health Metrics and Evaluation. This work suggests that in an outbreak that begins in January, the number of cases in hospital might peak at 2,790 (95%CI: 120 to 9,070) in early March 2022. Cumulative additional deaths might be 400 by 1 May, near the end of the outbreak (peaking at 10 deaths per day [95%CI: 0 to 50]). While there are various limitations and uncertainties with all such modelling, our impression is that this work is of high quality and should be considered by NZ policy-makers. But other factors, such as the social and economic disruption from such an Omicron outbreak, should also be important considerations in guiding preparations and preventive measures.
Photo by Luke Pilkinton-Ching, University of Otago Wellington
We have previously written about the need for more preparations in Aotearoa New Zealand (NZ) concerning a future national outbreak of Omicron variant of SARS-CoV-2 (our pre-Christmas blog and a blog last week). The NZ Government is obviously taking this threat seriously with a recent suspension of future places in MIQ. However, this change will not have an impact on arriving cases until March 2022. Therefore, substantially reducing the risk now will probably require a rapid and marked reduction of incoming international flights from some countries (ie, until their outbreaks subside in coming weeks).
But what is the likely impact of an Omicron outbreak in NZ if a border failure occurs? In this blog we look at the results of modelling by the Institute of Health Metrics and Evaluation (IHME) at the University of Washington in the US. This organisation is producing Covid-19 model results for nearly all countries in the world (https://covid19.healthdata.org/global?view=cumulative-deaths&tab=trend). They describe their model as being “a hybrid model that combines both a statistical modeling approach and a disease transmission approach, leveraging the strengths of both types of models, and scaling the results of the disease transmission model to the results of the statistical model.”
Findings of the IHME modelling for NZ
The modelling results for NZ are all shown online: https://covid19.healthdata.org/new-zealand?view=cumulative-deaths&tab=trend and we have detailed some key parameters in the Appendix to this blog. Summarised results for the reference scenario and two additional scenarios are in Table 1 below.
These findings suggest that for an outbreak of the Omicron variant in NZ, taking off in January, the number of cases in hospital might peak at 2,790 in early March 2022 (Figure 1). But this estimate comes with high uncertainty as the 95% confidence interval (95%CI) around this 2,790 figure is large at: 120 to 9,070. Cumulative additional deaths might be 400 by 1 May, (peaking at 10 deaths per day [95%CI: 0 to 50]; Figure 2). Further deaths are considered likely to occur in subsequent weeks, although daily deaths are down to 1-2 per day in early May when the modelling run ends (Figure 2). Relative to the reference scenario, both hospitalisations and deaths are reduced in the “third dose” scenario, and even further in the “80% mask coverage” scenario (Table 1). The outbreaks had a duration of around three months.
IHME also considers the impact on the NZ hospital system (Figure 23.1 in its NZ report). This graphic shows the hospital system moving into “high stress” in February (defined as 10-19% occupancy with Covid-19 patients). It then moves to “moderate stress” (5-9% occupancy) in March and then moves to “low stress” (<5% occupancy) in April. For ICU occupancy, there is a period of “extreme stress” (≥60% occupancy) from February to April (Figure 24.1 in IHME’s NZ report). In the comparison countries in the same region, this period of “extreme stress” for ICUs is a bit shorter for Australia, presumably due to higher ICU bed capacity per capita in that country.
Table 1: Projected impact of an Omicron outbreak in NZ as modelled by IHME (modelled from 10 January and data abstracted by us to generate this table)
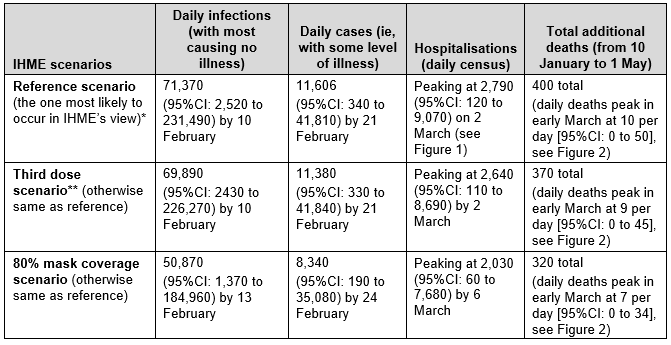
Notes: * The results for the “reference scenario” were the same as the “reduced vaccine hesitancy scenario” so we did not show the latter in this summary table.
** Assumes that 100% of those who have received two doses of vaccine will get a third dose at 6 months (which might be conservative given New Zealanders are encouraged to get a third dose/booster at 4 months).
Figure 1: Projected impact of an Omicron outbreak in NZ as modelled by IHME showing hospital bed and ICU bed demand for Covid-19 cases (figure re-produced by us from downloaded IHME data)
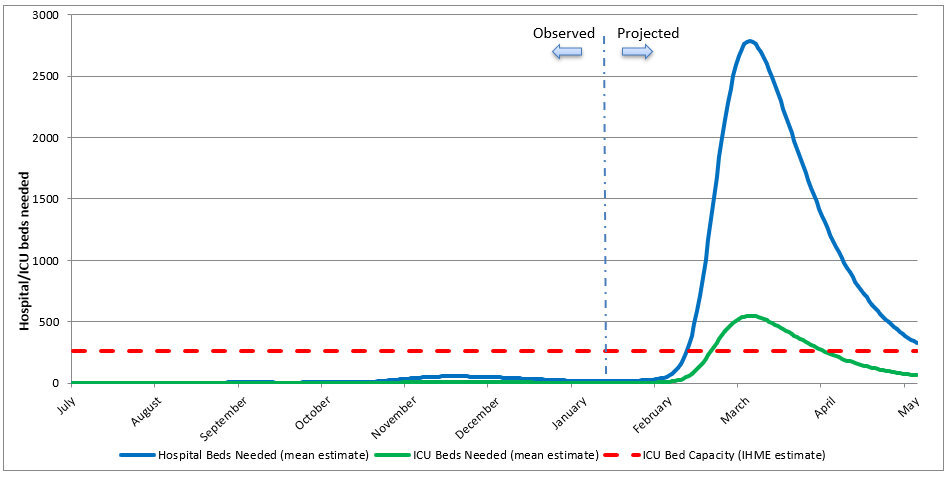
Figure 2: Projected impact of an Omicron outbreak on daily Covid-19 deaths in NZ as modelled by IHME (for the reference scenario [current projection] and two additional scenarios; figure re-produced by us from downloaded IHME data)

Comment on strengths and limitations of the IHME modelling
A strength of IHME modelling is that it comes from an organisation with a very strong track record for analysing health data (with some of the best epidemiologists, health data scientists and computer scientists in the world). This group regularly publishes their global burden of disease work in top scientific journals such as the Lancet and their key team members are involved in publications on Covid-19 modelling in top journals (eg, this study). Also a leading team member (Prof Chris Murray) has published on the performance of Covid-19 mortality modelling. Furthermore, our impression from what we understand of Omicron outbreaks in high-income countries (and what we are seeing occur in Australia at present), is that these modelling results for NZ by IHME have reasonable face validity for the point estimates of various scenarios.
Nevertheless, all such modelling has limitations and policy-makers need to consider these modelling estimates in the light of the following:
- There is no information on differential health impacts by ethnicity or socio-economic status (yet avoiding health inequities are important considerations, especially in NZ where Covid-19 has had much worse impacts on Māori and Pasifika populations).
- The modelling just considers the Omicron variant and yet it is possible that in coming months NZ could experience both an Omicron outbreak and a persisting Delta variant outbreak (although the latter could potentially be rapidly displaced by Omicron). Any such persisting dual variant outbreak could result in higher burdens of hospitalisations and deaths relative to the results in Table 1.
- While the IHME modelling considers some NZ-specific control factors, this is incomplete (eg, see footnote to Table 1 concerning the timing of booster doses). Furthermore, IHME data on ICU capacity in NZ might over-estimate true capacity (given a recent report on the very constrained ICU capacity in NZ at present). In particular, more sophisticated NZ-specific modelling would consider such issues as waning immunity levels for different age/ethnicity/occupation groups based on the timing of vaccination for these different groups (albeit a very complex modelling task). New Zealanders may also take an Omicron outbreak more seriously than the populations of other countries – and hence be more vigilant than expected with mask use (including using higher quality masks, such as N95s), physical distancing and such measures as working from home.
- Health impacts not considered in this IHME modelling include long-Covid amongst those infected and arising from delays in managing non-Covid-19 conditions (though IHME do estimate levels of “stress” on the hospital system). Of course severe Covid-19 outbreaks can also disrupt the health system at the primary care level and the running of preventive programmes (eg, routine childhood immunisation and screening programmes).
As well as considering the strengths and weaknesses of this IHME modelling, policy-makers will need to consider the potential social and economic disruption from an Omicron outbreak. This impact could be substantial given the severe strain seen on parts of Australian society at present. The model finding of periods of “high stress” on the hospital system and of “extreme stress” on ICU bed occupancy in NZ, suggests a risk of significant impacts on delivery of non-Covid-19 health care. As such there would seem to be a strong case to further delay an Omicron outbreak in NZ by reducing incoming arrivals of potentially infected travellers and reducing the burden on the MIQ system. This action will give more time for NZ to increase booster dose coverage, to vaccinate 5-11 year olds, and to learn from places like Australia about how best to protect the hospital system and critical supply lines.
Appendix – Selective notes on the IHME modelling and parameters used
This Appendix details some key aspects of IHME Covid-19 modelling (please see the specific NZ Report by IHME and this FAQ for additional details).
The model was run on 12 January, 2022, “with data through January 10, 2022”.
Reference scenario characteristics:
- “Vaccines are distributed at the expected pace. Brand- and variant-specific vaccine efficacy is updated using the latest available information from peer-reviewed publications and other reports.
- Future mask use is the mean of mask use over the last 7 days.
- Mobility increases as vaccine coverage increases.” [Mobility data is measured by smartphone app use in NZ].
- “Omicron variant spreads according to our flight and local spread model.
- 80% of those who have had two doses of vaccine (or one dose for Johnson & Johnson) receive a third dose at 6 months after their second dose.”
Vaccination coverage data was as per 10 January 2022: “83% of people in New Zealand have received at least one vaccine dose and 78% are fully vaccinated.” (It appears that these values don’t increase into the future according to Figure 20.1 in the NZ Report).
“We have modified the model to allow the incubation time to vary by variant. For Omicron, we assume it is distributed between 1 and 4 days, skewed toward 1 day. For all other variants, we assume it is 3 to 5 days, skewed toward 3 days.”
From Figure 10.1 (in the NZ Report) the infection-fatality rate (IFR) on 10 January 2022 is <0.2% (ie, the same category as for Australia). “This is estimated as the ratio of COVID-19 deaths to estimated daily COVID-19 infections.” Of note is if the peak deaths per day is divided by the peak infections per day (reference scenario, Table 1), this gives an IFR of 10/71,370 or 0.014%.
Vaccination effectiveness against the Omicron variant of the Pfizer/BioNTech vaccine: 44% against infection and 72% against “severe disease”.
Seasonality is considered: “seasonal disease transmission patterns where COVID-19 transmission appears to increase during the fall [autumn] and winter”.
* Author details: All authors are with the Department of Public Health, University of Otago Wellington.
Nice blog. Two comments:
1. So long as NZ MANAGES Omicron well (i.e. escalation of PHSMs as case number rise to slow it down and flatten the curve, masks required indoors as case number are climbing, boosting is targeted to people with comorbidity and the elderly), I would expect the peak number of people in hospital on any given day to be considerably LESS than IHME estimates. NSW is peaking right now at 2800 in hospital – a state with a 60% greater population size than NZ, and with a poor laissez faire let it rip approach to Omicron arriving (i.e. no serious attempt to flatten the curve). Victoria (population 6.7 million) looks like it is peaking now at a (pleasantly surprising to me) 1200 people in hospital on any given day – and NZ could manage or flatten the curve better than Victoria which whilst not a laissez faire let it rip as NSW, was not far of the same due to the Xmas and NY.
2. There is a fascinating commentary by Chris Murray just out in The Lancet. https://www.thelancet.com/journals/lancet/article/PIIS0140-6736(22)00100-3/fulltext. NZ can buck some of Chris’s comments in that you have time to boost.
Regards, Tony Blakely
There has been various media commentary on this IHME modelling – and we comment here on a few aspects. Firstly, New Zealanders might not have been used to thinking in terms of “numbers of infections” as opposed to “numbers of cases”. As such the IHME values for “numbers of infections” highlighted in the media might have sounded extra alarming – whereas the great majority of these infections include no illness or very mild symptoms that do not trigger a person to go and get tested. While we focused in our blog on hospitalisations and deaths (in the Abstract etc) – we did include all the other results to provide appropriate context and the media focused on these much larger numbers.
Secondly, the timing of the IHME model starting (early January) was probably earlier than when Omicron actually did start spreading in the NZ community. So perhaps the peak of the Omicron wave in NZ will occur a few weeks after the early March date that was in the IHME model results (or even latter if NZ is particularly good at “flattening the curve”). The first case of confirmed transmission in the community was reported on 23 January. Evidence of increasing Omicron spread was manifested in a sharp upward trend in daily cases on 27 January which is now continuing.
Thirdly, as per our comments in the blog on the limitations with the IHME modelling, we suspect that NZ might do a better job with pandemic control than the modellers assumed. That is with getting booster vaccinations, high mask use, physical distancing, and with people who are at increased risk (due to age or other health conditions) limiting their social contacts over coming weeks. On the other hand, it is concerning that the country permitted large music festivals at this time – as they may have helped with accelerating community spread of the Omicron variant.
Fortunately there are additional policy options that the NZ Government can consider to protect the public from the Omicron variant outbreak:
• Shortening the delay following the second vaccine dose and receipt of the booster from 4 to 3 months to allow a higher proportion of adults to qualify for a booster now (as is the UK and Australia).
• Adjusting the criteria for “My vaccine Pass” so that “fully vaccinated” requires a booster dose, as is now being phased in for essential workers in NZ.
• In the interim (while vaccine pass requirements are being updated), consider adjusting the requirements around indoor gatherings where people remove masks for sustained periods (eg, bars, restaurants, gyms). Even at the highest red light level, these regulations currently allow gathering sizes of up to 100 people when My Vaccine Pass is used, which may create a false sense of security.
• Providing free higher quality (eg, N95) masks to older and more vulnerable New Zealanders along with additional guidance on how they can protect themselves during the next few months when the Omicron outbreak will be most intense.
Michael Baker & Nick Wilson
Kia ora Michael Another striking characteristic of the tabulated data (and I confess I have not gone through the whole report) is the enormous degree of uncertainty it encompasses such that almost any outcome is within the 95% confidence interval of the estimates provided and all the estimates for each intervention are well within much less extreme confidence bounds than 95%. In the context of this uncertainty, it is important to more transparently lay out the advantages and potential problems with each suggested intervention eg expanding mandation of boosters without taking into account the limited impact and duration of boosters on infection. A risk-based approach which did everything possible to achieve equivalent booster coverage to the second dose coverage achieved in the over 50 years population would accomplish far more than ever-widening booster mandates in those below 40 years of age