
Dr Jennifer Summers, Professor Michael Baker, Professor Nick Wilson*
In this blog we review the impact of Aotearoa NZ’s Covid-19 response strategies on mortality patterns during the first 2 years of the pandemic. We find that NZ experienced an increase in life expectancy, decreased winter mortality, and net decline in (excess) mortality. These impacts are far more positive than experienced by all other high-income countries during this pandemic period. This picture supports the cautious elimination and suppression strategies used for the first 2 years of the pandemic and there has also been time to prepare the country for the current Omicron wave.
Over the last two years of the Covid-19 pandemic, NZ has used a range of public health measures that have played a direct role in keeping mortality from Covid-19 relatively low compared to other nations. For example, as of 19 February 2022 John Hopkins University reports NZ as having a Covid-19 mortality rate of only 1.08 per 100,000 population, which is the lowest amongst all high-income countries and the 4th lowest country globally (behind Burundi, China and Bhutan). This is a notable accomplishment for NZ as the Covid-19 pandemic has resulted in an estimated global excess death toll of over 19.6 million deaths (95% Confidence Interval [CI]: 14.2 to 23.1 million) according to The Economists recent estimates. Their estimated global total is far higher than the 5.8 million officially reported global Covid-19 deaths. As NZ now follows the paths of other nations grappling with Omicron and in NZ’s case, lingering Delta cases, it is worth reflecting on what has been achieved so far in terms of the health of the nation. This blog, explores changing mortality patterns in NZ during the first two years of the pandemic.
Reduced excess deaths in NZ
One measure of the net impact of events on mortality patterns is excess deaths which can provide information about the burden of mortality. Measures of excess death during the pandemic incorporate both indirect and direct deaths from Covid-19, and so is considered one of the more valid indicators of the mortality impact of the pandemic. Our World in Data have recently provided estimates of excess cumulative deaths per 100,000 population for 223 countries and regions based on data from The Economist. The measure is defined as the ‘difference between how many people died during the pandemic, from any cause, and how many deaths would have been expected had there been no pandemic’.
Using data from Our World in Data, figure 1 displays the estimated cumulative excess death per 100,000 for several selected countries, including NZ. With the estimates for the United States (USA), for the period of the pandemic, the cumulative excess deaths is 337 per 100,000, so the equivalent of 0.34% of their population have died in addition to the deaths that were expected based on pre-pandemic patterns. Taking the population of the USA of ~334 million and multiplying this by 0.34% gives a figure of ~1.14 million excess deaths since the start of the pandemic in 2020. This number is also in line with the recent estimates from the CDC which cite a figure of over 1 million deaths for the USA: ‘Although the vast majority of the excess deaths are due to the virus, the CDC mortality records also expose swollen numbers of deaths from heart disease, hypertension, dementia and other ailments across two years of pandemic misery’.
The United Kingdom (UK), Sweden and Denmark also have figures here with higher than expected cumulative excess deaths per 100,000. For Denmark, there appears to be a shift in the cumulative excess deaths since mid-2021, perhaps as a result of easing of public health protections. Similarly for Sweden – which initially aimed to achieve herd immunity with the now debunked strategy that assumed infection would provide long-lasting natural immunity. For the UK, much like the USA, there has been ongoing inconsistent or lack of sufficient public health protections throughout the pandemic.
With NZ, the estimated population is ~5.1 million, and per figure 1, the excess deaths is below ‘0’ (red dotted line) with -53.8 deaths per 100,000. This figure equates to 2,750 people in NZ not dying during the pandemic period relative to the expected numbers dying based on pre-pandemic estimates. This relative reduction in deaths during the pandemic has also been seen in Australia and Taiwan, both of which have used a range of public health protections and border restrictions such as suppression and/or elimination throughout the pandemic. Like NZ, these are ‘island’ jurisdictions which can convey an advantage for maintaining border restrictions in a pandemic.
Had NZ had the mortality experience of various other countries on a per capita basis over the first two years of the pandemic, we would have had additional deaths of 19,900 (USA experience), 13,700 (UK experience), 9,470 (Swedish experience), and 5,530 (Danish experience) compared to what we actually experienced.
Figure 1: Estimated cumulative excess deaths per 100,000 population during the Covid-19 pandemic in selected jurisdictions (based on data from The Economist: data extracted 17 February 2022)

All-cause mortality reductions in NZ
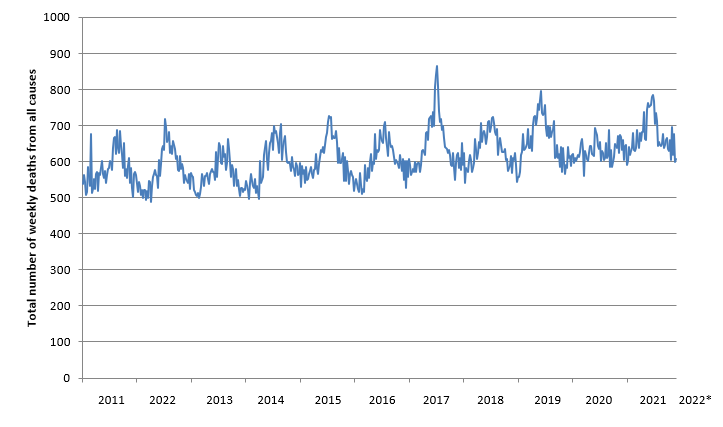
Data for the weekly deaths (all-causes) in NZ is freely available from Stats NZ. In pre-Covid years, the seasonal impact of mortality is evident, with higher mortality observed in winter months (figure 2). For example, there was a slight increase in mortality in the winter months of 2017, possibly due to a more virulent strain of influenza in 2017 with an associated increase in hospital admissions. Notably, for 2020, the seasonal effect of influenza is not evident, which is likely the effect of the Covid-19 lockdowns, public health measures and border restrictions, which nearly eliminated influenza in NZ for that year. One study reported that a particular seasonal influenza strain may have actually become extinct in Australia due to the public health protections introduced for Covid-19 during 2020 and 2021.
FluTracking data also indicates less reports of influenza-like illness symptoms such as fever and cough in the NZ population for the winter months in 2020 and 2021, compared to 2019 (pre-Covid). These findings build the case for some degree of ongoing public mask wearing, and also reinforce the co-benefits of Covid-19 control on other conditions (such as preventing influenza and community pneumonia). Therefore, it would be advantageous for a study of permanent masking in winter in some settings (eg, on public transport, in aged-care facilities) and a study of the cost-effectiveness of ventilation improvements in settings such as schools and workplaces.
Figure 2: All-cause weekly numbers of deaths in NZ for January 2011 to January 2022*, data provided by Stats NZ
Life expectancy gains for NZ
Stats NZ’s most up-to-date overall life expectancy at birth (average length of life) figures for NZ for 2017-2019 has females at 83.5 years and males at 80 years. Our World in Data ranks NZ as 26th in the world in 2019 for life expectancy with an overall value of 82.3 years. However, the effect of a global pandemic has impacted life expectancy estimates globally. A study by Islam et al published in late 2021 in the British Medical Journal evaluated the effects of the Covid-19 pandemic on life expectancy and premature mortality in 2020 in 37 upper-middle and high income countries/regions. Islam et al concluded that in 2020, life expectancy for both males and females was lower than expected in all countries except for NZ, Taiwan, and Norway. Specifically, this analysis found a gain in life expectancy in NZ of 0.66 years (95%CI: 0.41 to 0.89), equivalent to almost 8 months of extra lifespan per person. Furthermore, years of life lost was lower than expected in NZ, Taiwan, Norway, Iceland, Denmark and South Korea. The authors suggest that for NZ, Taiwan, Iceland and South Korea, these findings for 2020 ‘could be attributed to the successful pandemic elimination policies of these countries, including evidence based population health interventions’.
Conclusions
As a Covid-19 wave, largely fuelled by the Omicron variant, spreads throughout NZ for the first time, we may question what we have achieved. For example, what was the purpose of pursuing a cautious approach to Covid-19 (an elimination strategy for the majority of the pandemic then a suppression approach) with the associated use of tight border controls (quarantine), stay at home orders (‘lockdowns’), and other public health and social measures to contain transmission of this pandemic virus. One answer to this is the lives that NZ has saved by not letting Covid-19 ‘rip’ through the nation, as identified in this blog.
Delaying the widespread transmission of this pandemic in NZ has also allowed time for the vast majority of the population to be vaccinated in order to reduce the risk of death, serious illness and long-Covid. We will never know the specific individuals whose lives were saved, but the evidence for changes to mortality patterns in NZ clearly exists. And when these changes are compared internationally, the positive effects of NZ’s Covid-19 control is even more striking and profound.
* Author details: All authors are with the Department of Public Health, University of Otago, Wellington.
Could this analysis be highlighted to the NZ media please? It’s a good time to make people aware of the bullet we’ve dodged. Any other analyses looking at NZ hospitalisation numbers & all-cause excess mortality using rates from other countries would be valuable too I think. Thanks for all the important mahi you’re doing.
I understand that there is a theoretical cost of death that is sometimes used in business cases before treasury. Is it possible to equate this benefit relative to these findings as one measure of a successful strategic approach by NZ.
Just some additional sources where you can compare the performances of New Zealand to other countries.
The pandemic’s true death toll
Our daily estimate of excess deaths around the world
https://www.economist.com/graphic-detail/coronavirus-excess-deaths-estimates
An excellent site, you may have to register but it is free to view.
Lockdowns compared: tracking governments’ coronavirus responses
https://ig.ft.com/coronavirus-lockdowns/
Select New Zealand then add other countries to compare level of lockdown.
Country List Government Debt to GDP
https://tradingeconomics.com/country-list/government-debt-to-gdp
Sort by ascending last debt & compare NZ to others
https://www.theglobaleconomy.com/compare-countries/
Currently only up to 2020, but select the bar chart option then select , 2020 to 2021, select New Zealand and other countries to compare.
A similar study looking at the overall mental health of the nation compared to other countries would be beneficial. Short term it’s clear we have benefited from the strategy adopted by NZ, longer term might not be so compelling.
Agree it’s important to highlight the mortality success, but we should take care using life expectancy in a single-year period as the metric. https://longlifepensions.com/2021/08/06/effect-of-pandemic-on-life-expectancy/
An update on the above analysis:
Further work on excess mortality was published by the World Health Organization in May 2022 (https://www.who.int/data/stories/global-excess-deaths-associated-with-covid-19-january-2020-december-2021). Analysing the data for NZ (the file with country data) it suggests that from the start of 2020 to the end of 2021 there were 2677 (2206 to 3178) fewer deaths in NZ than expected. There was some month-to-month variation but even during the 2021 year there were only 3 months in which there were more deaths than expected (January, March and December), and for all the other months there were fewer deaths than expected. This picture is compatible with most other published data on excess deaths for NZ during this period.
Nick Wilson & Jennifer Summers