There are striking inequalities in cancer incidence and mortality in NZ, by both ethnicity and socioeconomic status. In this blog, we introduce an interactive online tool that enables anyone from researchers, policy-makers, journalists and health practitioners to access high quality data on these vital, population-level health statistics. Examples we use include: massive declines in cardiovascular disease inequality, but still large inequalities such as widening gaps in mortality for diseases consistent with the obesity epidemic; and the fact that adults aged 25-44 years with no formal qualifications have had very little mortality decline in the last 30 years, begging the question “Why?”.
Striking inequalities in health in NZ
In this country there are striking inequalities by ethnicity – for example, Māori life expectancy is 7 years less than for European/Pakeha New Zealanders (1). Also four times as many Māori women die of lung cancer than their European/Pakeha counterparts (2). The human cost of the premature death and cancer diagnoses resulting from these inequalities provide the backdrop and motivate much of the public health work in NZ.
However, these data have not always been readily available online for users to analyse themselves, and the public health community has been reliant on reports and research publications to gain access to the main trends. To bring this important data closer to users we have developed a user-friendly interactive online graphing tool. Below we outline the motivation for developing the Data Explorer and outline how some of our key research findings can be identified using this tool.
High quality data publicly available online
The data used to monitor these inequalities comes from the NZ Census Mortality and CancerTrends (NZCMS/CT) Study – a record linkage study of census data, mortality data, and cancer registrations. The data are high quality, and provide the basis for many important public health studies: for example, lung cancer incidence rates are used to model the cost-effectiveness and impact on mortality inequalities of tobacco control interventions (3).
The Data Explorer provides a flexible and interactive tool to access the data generated by the NZCMS/CT. The importance of the data lies in its richness with aggregate-level demographic information on mortality and cancer incidence in NZ and trends in ethnic and socioeconomic inequalities over time. However, the skills and time required to analyse these data mean that it’s a resource that is not being fully utilised. This Data Explorer enables unique analysis of population-level public health data by the wider public.
Given the expansive detail of the NZCMS/CT study, the key feature of the Data Explorer is its flexibility. The data can be restricted and compared by cause of mortality, type of cancer incidence, ethnic group, income group, education level, or age-group. Through the drop down menus, users can focus on specific population groups, compare groups within society, or do both.
With its most expansive lens, the Data Explorer has the capability to display variations in mortality and cancer incidences over time for all of the NZ population in aggregate. In contrast, in its most nuanced form, the Data Explorer can examine a certain cause of mortality across time for a specific population stratified by a third variable on separate plots. The Data Explorer is user controlled, allowing powerful and numerous insights into causes of death and inequalities in this country.
Declining rates, but persistent cardiovascular (CVD) inequalities
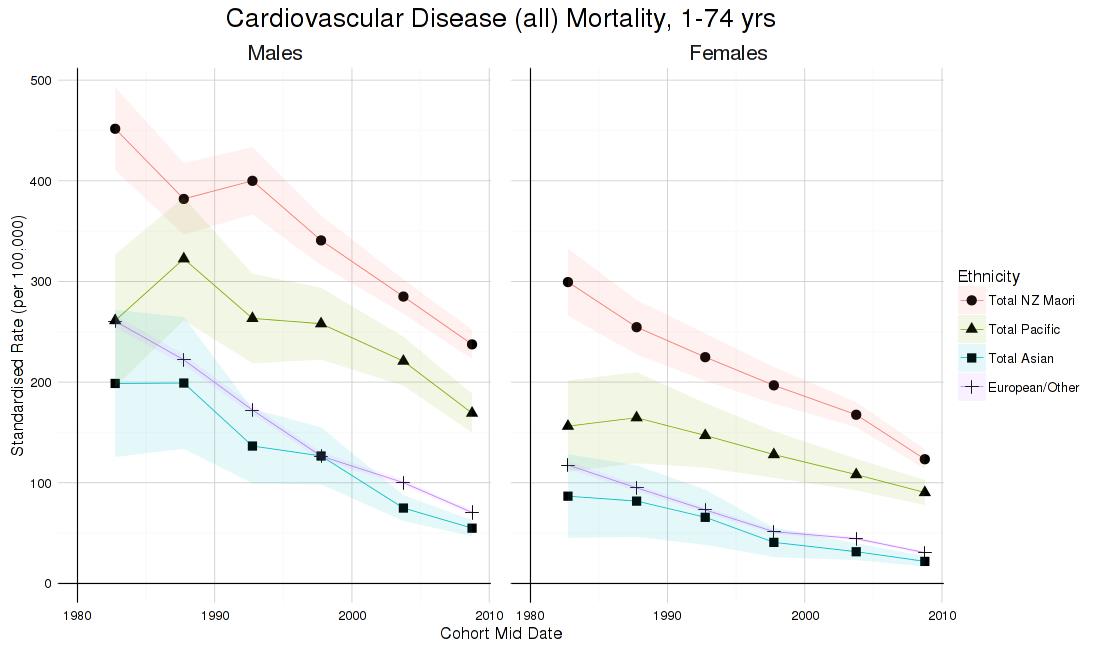
 One of our key research findings has been the continued decline of CVD rates for all ethnic groups, but with sizeable inequalities for both Māori and Pacific peoples, in relation to the European/Other group (2).
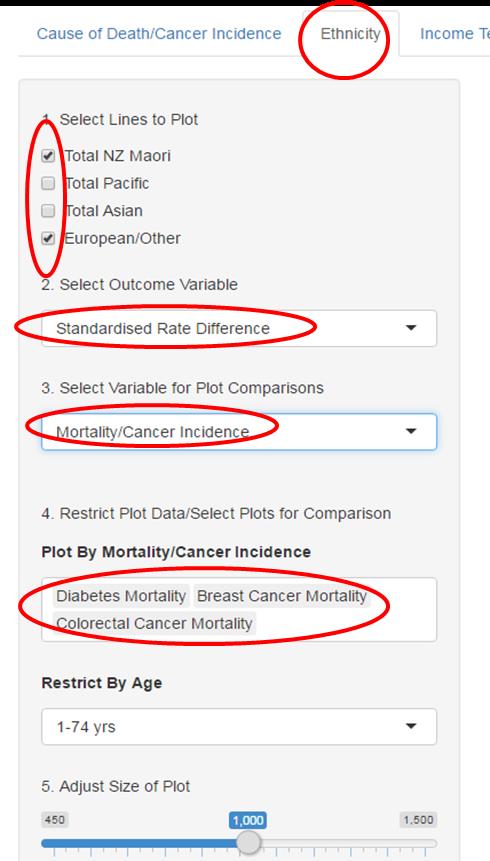
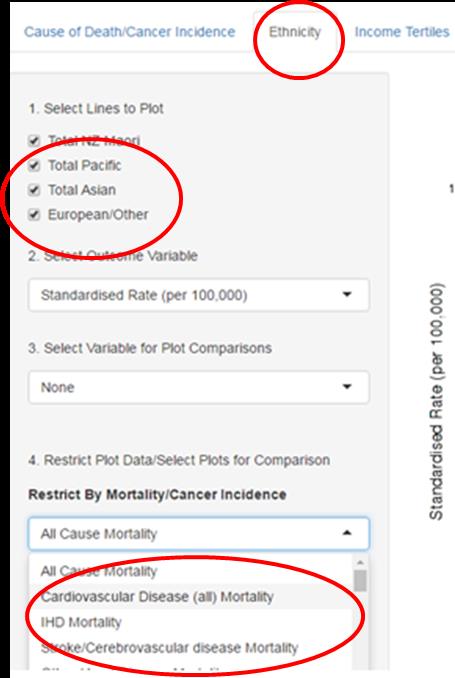
A graph to view these trends can be made on the “Ethnicity” tab of the Data Explorer: the ethnicities of interest can be selected by checking the appropriate boxes; and “Cardiovascular Disease” selected from the drop down menu at the bottom of the screen shot (all steps circled in red).
These selections produce the graph below, which shows declining rates in CVD for each ethnic group (Māori, Pacific, European/Other and Asian) for males and females respectively. Māori mortality for CVD is still much higher than European/Other, and for females, it is clear that the decline for Pacific peoples is resulting in widening relative inequalities for that group.
 Increasing importance of obesity-related mortalities and cancers in driving absolute inequalities
 Through detailed exploration and analysis of the NZCMS/CT Study data we have also found that obesity-related and cancer mortalities are becoming more prominent in driving the well-documented overall trends in ethnic inequalities in health in NZ (4).
The Data Explorer allows users to produce numerous graphs simultaneously to compare multiple mortalities/cancer incidences within one population group, or, conversely, a single mortality/cancer incidence across multiple population groups.
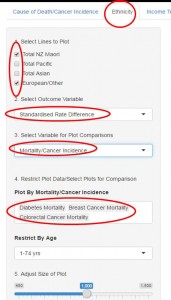
A graph to analyse how absolute inequalities between Māori and European/Other are changing for non-lung cancer, colorectal cancer, breast cancer and diabetes can also be made on the Ethnicity tab. Just Māori and European/Other are ticked; “Standardised Rate Difference” is the outcome variable selected to give the absolute inequality statistic for the plot. Selecting “Mortality/Cancer Incidence” from the “Select Variable for Plot Comparisons” menu produces multiple plots of the mortalities selected; and the plot can be resized using the slider at the bottom.
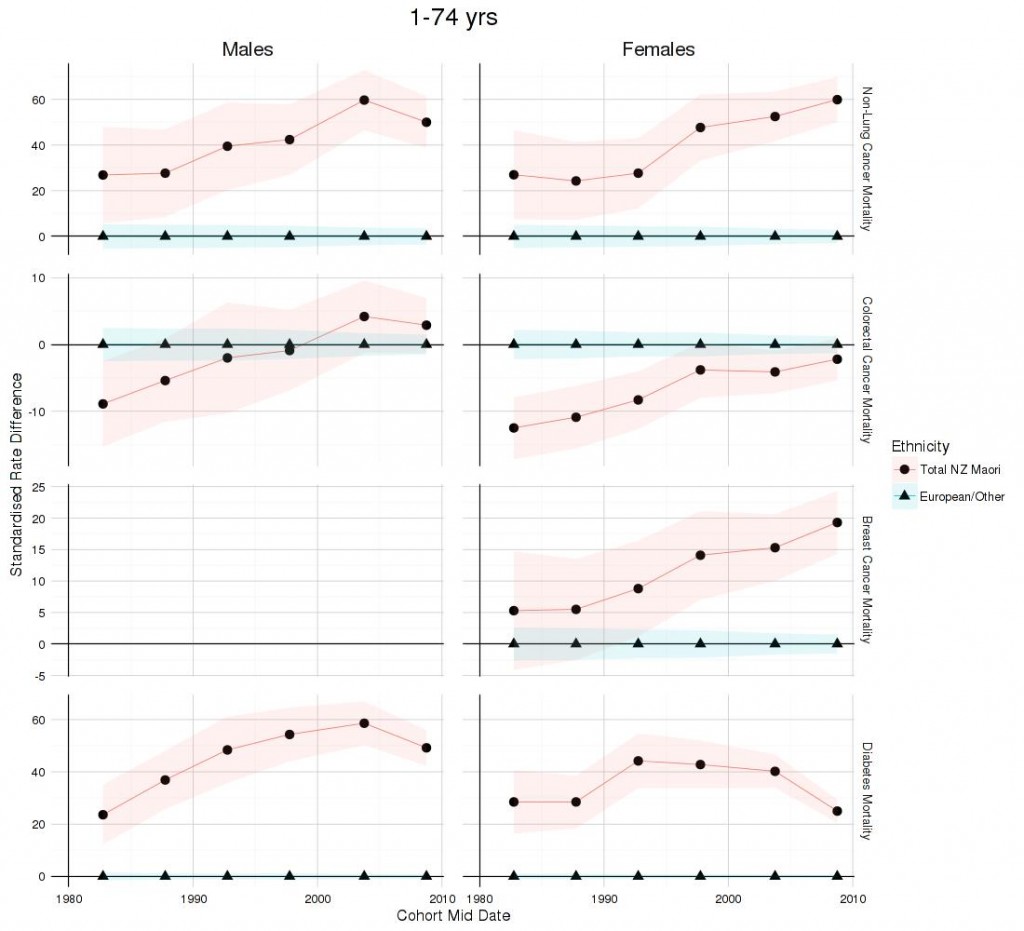 From these plots it is clear that absolute inequalities have increased between Māori and European/Other for non-lung cancer. If there isn’t already (confidence intervals are overlapping) there is soon likely to be inequalities in colorectal cancer mortality, where in the past Māori had lower rates than the NZ European population. Absolute inequalities in breast cancer have increased substantially (now up to 20 per 100,000 higher for Māori) and inequalities in diabetes mortality are sizeable.
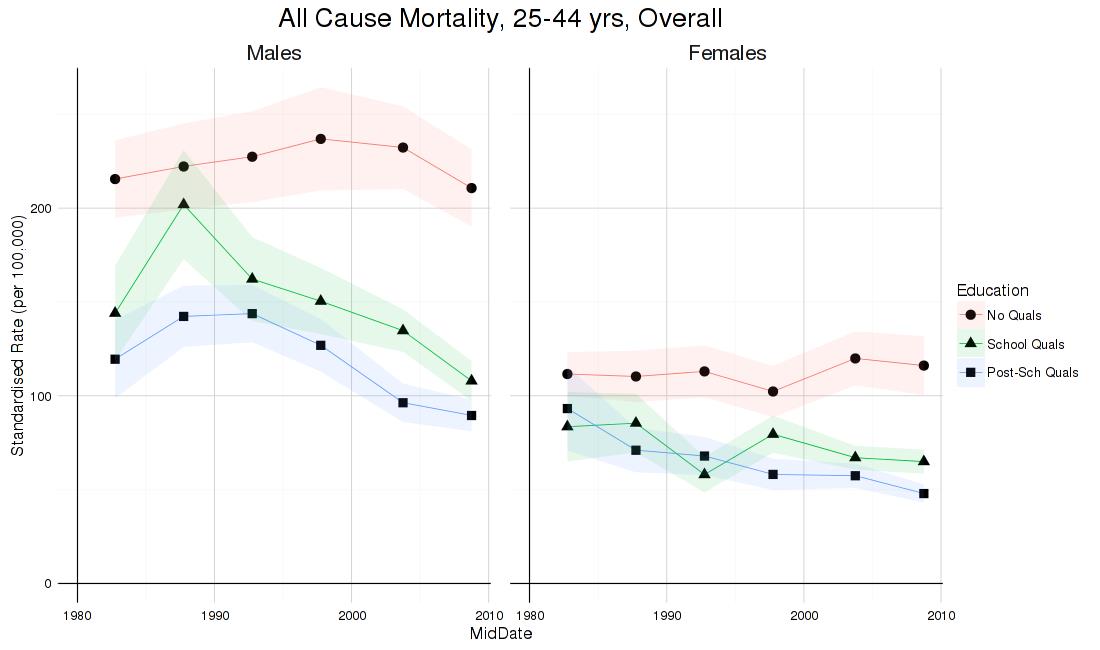
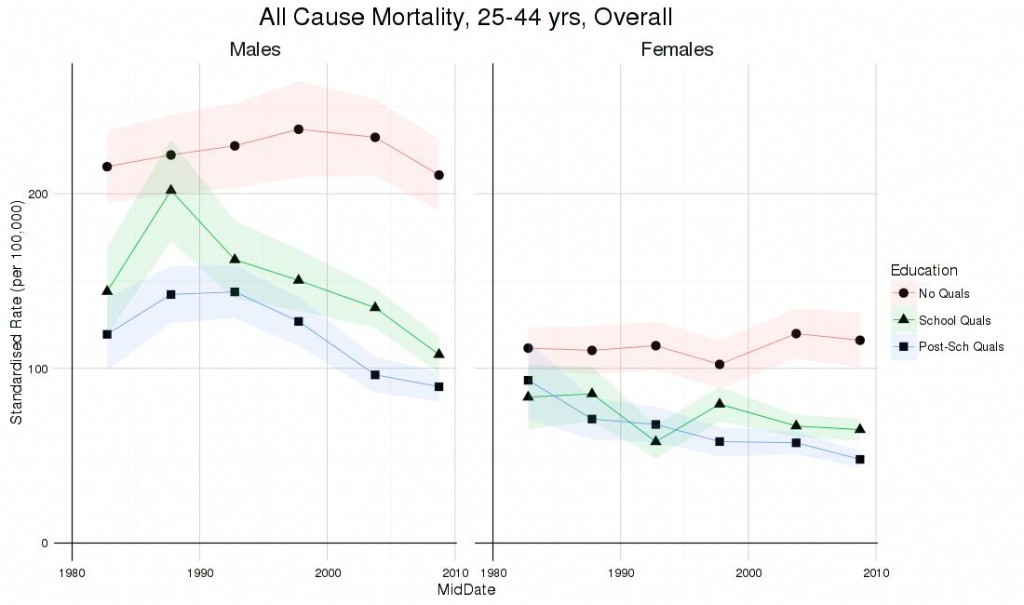
Little decline in mortality for young people with no qualifications
So far, each of the selections described above has looked at 1-74 year olds on the ethnicity tab. In this final selection we shift to look at mortality rates for young people with no qualifications. This graph is produced on the Education tab.

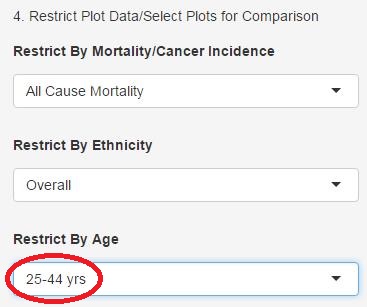
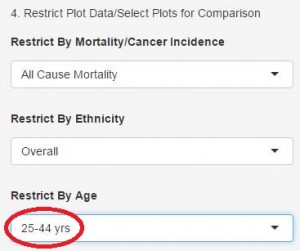 To restrict the graph to just an analysis of young people, “25-44 yrs” is selected from the “Restrict by Age” drop down menu. The defaults (All-Cause Mortality and Overall) are kept in the remaining menus, so that the graph includes all ethnicities and mortality.
The graph these selections produces is below. It is clear that, for both men and women, mortality rates have not fallen for people with no qualifications. Whereas, for people with school and post-school qualifications there have been falling mortality rates and the gap between the two is very small in comparison to the gap between the “No Qualifications” trend and the benchmark of “Post-School Qualifications”. Options to examine education, income and deprivation inequalities are available.
 In summary, we envisage this online Data Explorer will facilitate greater understanding of mortality and inequality trends in the NZ setting. We welcome feedback on this tool and ways it might be improved upon.