
Prof Tony Blakely, Dr Andrea Teng, Prof Nick Wilson
Policy-makers need to know how much of ethnic inequalities in health are due to socioeconomic position and tobacco smoking, but quantifying this is surprisingly difficult. In this Blog, and accompanying video, we summarize new research using NZ’s linked census-mortality data, blended with innovative new ‘counterfactual’ methods to determine causal relationships that can shed light on policy-relevant questions. A half or more of Māori:European/Other inequalities in mortality are due to four socioeconomic factors (education, labour force status, income and deprivation), and this percentage is stable over time for males but increasing for females. Eradicating tobacco will not only improve mortality for all sociodemographic groups, but reduce absolute inequalities in mortality between Māori and European/Other by a quarter. It is hard to think of another intervention that will reduce inequalities by as much.
“How much of ethnic inequalities in health are due to socioeconomic position?” And “How much are these inequalities due to tobacco smoking?” are important questions for policy-makers.
The problem is these questions are surprisingly hard to answer. Why? Because of what would generally be termed “correlation is not causation” and “it is challenging to decipher causal pathways from data we observe only once, i.e. history as it unfolded”.
However, these questions are so important – and related questions about what causes inequalities more generally, and even more generally questions of “what mediates the causal association of exposure X with outcome Y?” – that a massive methodological push has been made internationally to generate better and better methods to answer these questions.
In this Blog we summarize our open access research just published in the journal Epidemiology [1]. There is also an accompanying video of Tony Blakely presenting the findings in a seminar.
What did we do?
We used linked NZ census-mortality data, covering three decades. This is actually ground-breaking – we are not aware of any other study that has looked at mediation of ethnic inequalities on similar data over three decades for an entire country.
We examined Māori compared to European/Other mortality inequalities (differences in mortality rates) – the data was too sparse for Pacific and Asian. For socioeconomic mediators, we used labour force status, education, deprivation (NZDep), and household income – as measured at the census at the beginning of the 3 to 5 year follow up of each of the 1981, 1996 and 2006 censuses. For smoking, we used the simple current, ex and never categorization at these same censuses.
We then used counterfactual methods – a.k.a. potential outcomes. (For those of you curious about the methods, there is a brief introduction at the end of this blog – as per this journal article.)
What did we find?
We looked at three research questions.
Question 1: How much of ethnic inequalities in mortality are mediated by socioeconomic position?
Interestingly, for males it was 46% for each of the 1981-84, 1996-99 and 2006-11 cohorts. But for females, it steadily increased from 30% (95% confidence interval: 18% to 43%) in 1981–84 to 42% (36% to 48%) in the 2006-11 cohort. (Table below.)
Table: Percentage mediation (95% confidence intervals) of Māori:European/Other mortality inequalities
| 1981-84 | 1996-99 | 2006-11 | |
| Males | |||
| % Mediated (SEP) | 46.4 (31.4, 62.3) | 46.6 (39.6, 53.6) | 45.6 (40.3, 50.7) |
| % Mediated (SEP + Tob) | 47.1 (31.6, 63.2) | 47.8 (40.7, 54.6) | 47.6 (42.4, 52.8) |
| Mediation Change (SEP to SEP + Tob) | 0.8 (-2.4, 4.0) | 1.2 (0.4, 2.8) | 2.0 (1.2, 2.8) |
| Females | |||
| % Mediated (SEP) | 30.4 (18.1, 42.7) | 37.1 (29.4, 43.8) | 41.9 (36.0, 48.0) |
| % Mediated (SEP + Tob) | 33.5 (20.6, 46.3) | 40.8 (33.3, 47.9) | 49.7 (43.4, 55.7) |
| Mediation Change (SEP to SEP + Tob) | 3.0 (1.7, 7.4) | 3.7 (1.5, 5.8) | 7.7 (5.5, 10.0) |
SEP = socioeconomic position, including education, labour force status, household income and small area deprivation (NZDep). Tob = tobacco smoking
Interpretation: The unequal distribution of socioeconomic position between Māori and European/Other, due to many reasons from the legacy of colonisation to current day discrimination in the workforce, explains a stable percentage of male inequalities in mortality over time. Further, this ‘percentage mediation’ will be greater than 46% – perhaps two-thirds or so – as even though our linked census-mortality studies are high quality and powerful, we still only measure income (approximately) in the year before census night (not over the lifecourse), an approximate measure of education (not quality), and so on. Better measurement of individuals’ socioeconomic factors (e.g. with lifelong cohort studies) would almost certainly see more mortality inequalities explained. Conversely, it also seems unlikely that better and better measurement of socioeconomic factors will explain all of the ethnic inequalities; there will be pathways from ethnicity to health that do not go through socioeconomic position (e.g. direct discrimination, tobacco consumption related to ethnicity – see next research question).
The increasing role of socioeconomic position as an explanation for excess mortality in female Māori females makes theoretical sense, with increasing workforce participation of females over time and increased salience of females’ own socioeconomic position (compared to, say, male partner’s socioeconomic position).
Question 2: What is the incremental increase in mediation when including smoking over and above socioeconomic position, and does this change over time?
As hinted above, we expect smoking to be a major contributor to ethnic inequalities in mortality – both because smoking is determined by socioeconomic position (and hence this contribution will be captured under research question 1 above) and because smoking is patterned by ethnicity for reasons other than socioeconomic position (e.g. Māori females have smoked at high rates ever since first contact with European explorers, whalers, sealers and then settlers). This research question addresses the latter component. We found that including smoking in addition to socioeconomic factors only modestly altered the percentage mediated for males, but more substantially increased it for females, for example, 8% (95% CI: 6% to 10%) in 2006–2011.
Interpretation: Tobacco smoking is on pathways from ethnicity to mortality inequalities that do not include socioeconomic position for females – which makes sense given what we know about particularly high tobacco smoking rates for Māori females.
Question 3: If, counter-to-fact, NZ had been tobacco free, how much less would current ethnic inequalities in mortality be?
This is a different question and analysis to the above two so-called ‘natural’ effects analyses, which aim to understand the way the world is. In this research question we model everyone as never smokers. The counterfactual is of Captain Cook (and all subsequent settlers) having never brought tobacco to Aotearoa NZ. In this question and analysis we do not manipulate peoples’ socioeconomic position. Rather, we leave that untouched and counterfactually flip everyone to the mortality risk we would expect had they been never smokers (a so-called ‘potential outcome’). Whilst a counterfactual question, it is arguably a more relevant policy question as it starts to speak to what would happen with dramatic reductions in tobacco smoking – consistent with the 2025 tobacco free goal for NZ.
Here, everyone – Māori and European/Other, males and females – enjoys profound reductions in mortality risk. The figure below is for 2006-11. Here is the good news – the absolute gap in mortality risk between Māori and European/Other reduces by 15% for males and 24% for females. It is hard to think of another intervention that would be so inequality reducing. (But there is some not so good news too. On a relative risk scale, the gaps hardly change at all as Māori and European/Other mortality risks reduce by about the same percent. Ideally, we want both absolute and relative inequalities to reduce, but it seldom happens – see another study we have published on this.)
Figure: Annual mortality risks for 25-74 year olds in 2006-11, by sex, as observed (darker blue and red) and counterfactually had there never been tobacco in NZ (lighter blue and red) 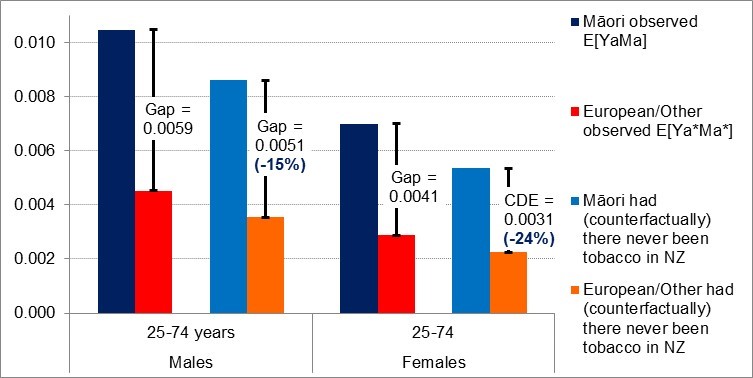
If you want to know more about the methods….
… see the study we published in the journal Epidemiology [1]. We have made it open access, so it is easy to get.
On the methods side, it is at the leading edge using potential outcomes approaches – but there could be yet further improvements. A commentary in the same issue of Epidemiology by John Jackson speaks to the use of ‘randomized intervention analogues’. They take a bit to get your head around, but are flexible and clever, emulating randomized trials of shifting mediator distributions. At the moment, these methods are rapidly being developed. Should policy-makers and researchers care? Probably. We believe these methods get us closer and closer to answering the questions that you want answered – as outlined at the beginning of this Blog. Watch this space.
For a YouTube clip of Tony Blakely presenting these results and methods, assisted by Kermit and Miss Piggy impersonations, view here.
This blog illustrates just one example of what can be done with NZ’s great data. There is ample and exciting potential to apply new causal inference methods to answer policy relevant questions – an issue we will take up in a forthcoming blog and accompanying video.
References
- Blakely T, Disney G, Valeri L, Atkinson J, Teng A, Wilson N, Gurrin L: Socio-economic and tobacco mediation of ethnic inequalities in mortality over time: Repeated census-mortality cohort studies, 1981 to 2011. Epidemiology 2018, 29:506-516.
- Blakely T, Cobiac LJ, Cleghorn CL, Pearson AL, van der Deen FS, Kvizhinadze G, Nghiem N, McLeod M, Wilson N: Health, health inequality, and cost impacts of annual increases in tobacco tax: Multistate life table modeling in New Zealand. PLoS Med 2015, 12(7):e1001856. [Correction at: http://journals.plos.org/plosmedicine/article?id=1001810.1001371/journal.pmed.1002211].
- Cleghorn CL, Blakely T, Kvizhinadze G, van der Deen FS, Nghiem N, Cobiac LJ, Wilson N: Impact of increasing tobacco taxes on working-age adults: short-term health gain, health equity and cost savings. Tob Control 2017.
- Nghiem N, Cleghorn CL, Leung W, Nair N, van der Deen FS, Blakely T, Wilson N: A national quitline service and its promotion in the mass media: modelling the health gain, health equity and cost-utility. Tob Control 2017, (E-publication 24 July).
- van der Deen FS, Wilson N, Cleghorn CL, Kvizhinadze G, Cobiac LJ, Nghiem N, Blakely T: Impact of five tobacco endgame strategies on future smoking prevalence, population health and health system costs: two modelling studies to inform the tobacco endgame. Tob Control 2017, (E-publication 24 June).
Tony, Andrea, Nick thanks for your high-quality work. Very helpful. Great summary and excellent video presentation.
Thanks Tony et al…very useful. What proportion of inequity in outcome would be modified by salt reduction?
Good question Fran. Off the top of my head, not sure. But there might be a way to roughly cross-walk it using our salt and tobacco BODE3 model relative impacts… thinking about it, and will post an answer back here if I think it is robust enough for public consumption.
In the meantime, Fran, what salt intervention? I.e. which one(s) from all the salt intervenitons at the BODE3 interactive league table at http://www.otago.ac.nz/bode3.
Best
Tony
Thanks for the high quality study. This is very revealing and although I am not a New Zealander, it gives an idea of the potential effect of discrimination and other negative social forces on minorities the world over.