
Prof Nick Wilson, Dr Leah Grout, Dr Jennifer Summers, Dr Nhung Nghiem, Prof Michael Baker (author details*)
Aotearoa/NZ has achieved the lowest death rate in the OECD from the COVID-19 pandemic, equivalent to around 2000 lives saved compared to the OECD average. With regard to economic harm, NZ appears to be close to the OECD average, with the IMF predictions for GDP in 2020 overall being -6.1% for NZ and -6.3% for the OECD. Nevertheless, a fuller accounting of health, economic and equity impacts probably needs to wait until vaccination is sufficiently available and border restrictions are lifted. Despite NZ’s health success there is still a need to improve border controls (eg, with a “traffic light” system), until the population is protected by vaccination.

Image by fernando zhiminaicela from Pixabay
As with a number of other jurisdictions in the East Asia and Pacific region, New Zealand (NZ) adopted very tight border controls and other measures in response to the COVID-19 pandemic. However, NZ has been the only country to actually articulate an unambiguous elimination strategy and to have achieved this.1 2 In this blog we aim to provide an updated description of the health and economic impacts of the NZ approach to inform decisions around ongoing controls (until vaccination arrives and coverage is sufficiently high to protect vulnerable populations and prevent any transmission).
We made health and economic impact comparisons between NZ and other OECD countries which all took an alternative mitigation/suppression approach to the pandemic (albeit Australia used an “aggressive suppression” strategy that still had elimination as a potential outcome). Mortality data for COVID-19 were from the Worldometers website3 for probable and confirmed deaths. Data on quarterly GDP changes (relative to the previous quarter) were from the OECD4 and the NZ Treasury;5 GDP forecasts were from the IMF;6 and unemployment data were from the OECD.7
NZ best in OECD for health impacts
As of 22 November 2020, NZ had the lowest cumulative COVID-19 mortality in the OECD (25 deaths, 5 per million population vs a 36-OECD-country average [excluding NZ] of 406 per million). NZ’s death rate was also 54 times lower than the average for other island nations in the OECD (see Figure). This represents the prevention of around 2000 deaths in NZ. Furthermore, using estimates for life expectancy loss from COVID-19 in high-income countries (North America and Europe),8 this represents the prevention of around 18,000 life-years lost (range 12,000 to 31,000) in NZ compared to the OECD average. A fuller accounting of the health impacts is not yet possible but other benefits would include: (i) the marked reduction in overall (all-cause) mortality observed in relation to the lockdown;9 10 (ii) the prevention of “long COVID” where long-term illness may occur even in people with mild or no symptoms during their initial infection;11 and (iii) the prevention on anxiety in the population from reduced risk of infection. However, on the other hand, there are the mixed impacts on mental health of the lockdown in NZ,12 13 and the potential adverse impacts of the lockdown on delayed healthcare.14 15 Also, the increased unemployment seen in NZ may result in increased cardiovascular disease risk.16
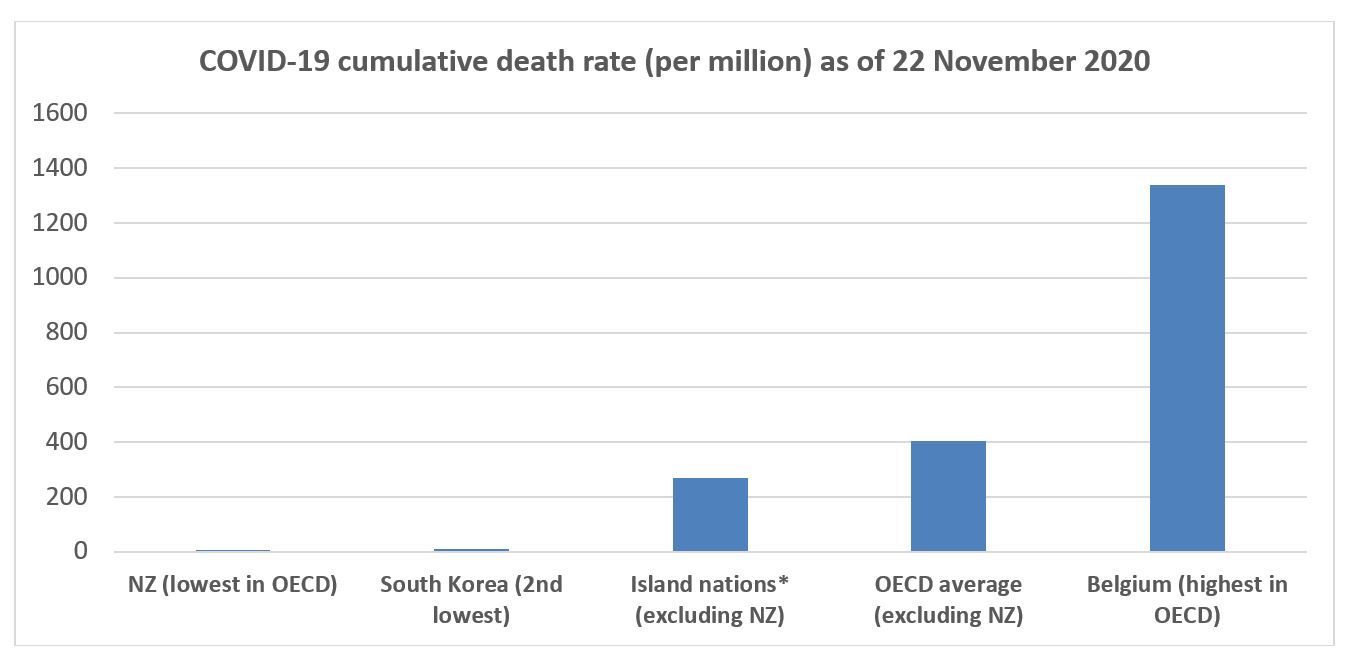
* Island nations in OECD (other than NZ): Australia, Iceland, Ireland, Japan, and the United Kingdom.
NZ mid-range in OECD for economic harm
NZ’s tight border restrictions (impacting international tourism and overseas student arrivals) and stringent lockdown in response to the initial outbreaks in March/April 2020 (as per a stringency index17) resulted in an overall economic downturn for NZ in the first half of the 2020 year. In the first quarter (Q1), the changes were fairly similar to the OECD: -1.4% (NZ) vs -1.9% (OECD); and in Q2 these were -12.2% (NZ) vs -10.6% (OECD). However, in Q3 the rebound was greater for NZ at +12% (estimated5) vs +9.0 (OECD, albeit not all countries had data). Further increases in consumer confidence have been seen in Q4 in NZ (preliminary data).18 For 2020 overall, the IMF prediction for GDP annual reduction was -6.1% for NZ and -6.3% for the OECD6 (though a more recent -3% prediction comes from a NZ bank19). The Q3 unemployment levels were 5.3% (NZ) and 7.6% (OECD),7 potentially helped by the NZ Government’s wage subsidy and other interventions to ease the economic impacts. Nevertheless, as with the full accounting of the health impacts, a longer-term perspective will be needed to appropriately evaluate the economic impact.
Could NZ have done even better on health impacts?
While having the lowest COVID-19 death rate in the OECD, NZ was still behind Taiwan which has had even lower rates of cases and deaths (eg, 7 deaths,20 0.3 per million population). Taiwan was much better prepared than NZ for a pandemic, had better border control early on, made better use of mass masking, and has continued to be ahead of NZ in use of digital technologies to support pandemic control.21 Furthermore, the NZ response remains suboptimal when considering the run of 8 recent border control failures – one of which caused 176 cases and 3 deaths.22 Similarly, there have been 76 breaches of the rules in MIQ facilities (such as unauthorised mixing or failing to wear PPE) since the start of August.23 There remains scope for NZ to use more science-based risk assessment as part of border controls (eg, a “traffic light” system24).
Could NZ have done better on reducing economic impacts?
Some caution is needed with GDP comparisons across countries as illustrated in a recent article on the US compared to other nations25 (eg, relating to country size, dependency on trade and tourism etc). Nevertheless, NZ clearly trailed Taiwan in economic performance. Taiwan managed the pandemic without a lockdown and the IMF prediction was for no change in GDP growth (ie, 0.0%) for Taiwan in 2020 overall (vs -6.1% for NZ).6 However, given NZ’s lack of pandemic preparations26 and public health infrastructure compared to Taiwan,21 a lockdown was probably inevitable if NZ was to succeed with elimination.
Fortunately, NZ did not make the same mistake as Iceland, which re-opened mid-year to tourism from many countries. Tourism flows were low (20% to 25% of normal for summer) and the tourists triggered further outbreaks of COVID-19, which led to subsequent tightening of border controls in Iceland.27 This re-opening action may have contributed to Iceland’s GDP for 2020 as per IMF projections being down more than for NZ (Iceland: -7.2% vs NZ: -6.1%). Iceland also had a higher COVID-19 mortality rate than NZ (76 vs 5 per million population).
Nevertheless, the length of the first lockdown in NZ and the second one in Auckland in August, could probably have been shortened if NZ had:
- made earlier and more comprehensive use of mass masking (as per many Asian countries);
- more rapidly adopted digital technologies for supporting contact tracing (eg, as per South Korea); and
- adopted a more sophisticated Alert Level system with a stronger focus on closing high risk settings (eg, gyms, restaurants, bars, nightclubs, churches), which might have meant that other settings could have been re-opened earlier.
The economic harm to NZ might also have been reduced if the NZ Government’s economic support had been better targeted. For example, large companies with high profits reported in 2019 might not have needed the wage subsidy (or alternatively it could have been directed specifically at low-income workers in these companies).
Could NZ have done better on equity outcomes?
The NZ pandemic response may have been influenced by ethical considerations, including equity.28 Indeed, COVID-19 elimination was a highly pro-equity strategy as it minimised cases and deaths which were widely expected to show a large ethnic and socio-economic gradient (as per past influenza pandemics impacting on Māori29 and low-income New Zealanders30). The pandemic response and economic contraction is now the major way in which the pandemic is likely to cause inequitable outcomes. The Government’s economic response will be helping but, as discussed above, it might not always have been optimally targeted. These equity consequences will need close monitoring and research, which will hopefully guide further policies to minimise their adverse effects on health and wellbeing.
In summary, NZ has achieved the lowest death rate in the OECD from the COVID-19 pandemic, equivalent to around 2000 lives saved compared to the OECD average. Nevertheless, a fuller accounting of health, economic and equity impacts probably needs to wait until vaccination is sufficiently available and border restrictions are lifted. Also, despite NZ’s health success, there is still a need to improve border controls (eg, with a traffic light system), prior to the arrival of vaccination.
*Author details: Nick Wilson,1,2 Leah Grout,1 Jennifer Summers,1 Nhung Nghiem,1 Michael G Baker2
1 BODE3 Programme, University of Otago Wellington, New Zealand
2 HEIRU, University of Otago Wellington, New Zealand
References
- Baker M, Kvalsvig A, Verrall A, Telfar-Barnard L, Wilson N. New Zealand’s elimination strategy for the COVID-19 pandemic and what is required to make it work. N Z Med J 2020;133(1512):10-14.
- Baker MG, Wilson N, Anglemyer A. Successful elimination of Covid-19 transmission in New Zealand. N Engl J Med 2020;(7 August) doi:101056/NEJMc2025203 https://wwwnejmorg/doi/101056/NEJMc2025203?url_ver=Z3988-2003&rfr_id=ori:rid:crossreforg&rfr_dat=cr_pub%20%200pubmed
- Worldometers. COVID-19 Coronavirus Pandemic. Worldometers (22 November 2020 data). https://www.worldometers.info/coronavirus/.
- OECD. Quarterly GDP (indicator). doi: 10.1787/b86d1fc8-en. https://data.oecd.org/gdp/quarterly-gdp.htm (Accessed on 22 November 2020)
- The Treasury. Pre-election economic and fiscal update. Wellington, New Zealand, 2020 (16 September). https://www.treasury.govt.nz/publications/efu/pre-election-economic-and-fiscal-update-2020-html.
- International Monetary Fund. World Economic Outlook Database. (October 2020). https://www.imf.org/en/Publications/WEO/weo-database/2020/October/download-entire-database.
- OECD. Unemployment rate (indicator). doi: 10.1787/52570002-en (Accessed on 22 November 2020). https://data.oecd.org/unemp/unemployment-rate.htm.
- Marois G, Muttarak R, Scherbov S. Assessing the potential impact of COVID-19 on life expectancy. PLoS One 2020;15:e0238678. (Table S1).
- Wilson N, Mizdrak A, Summers J, Baker M. Weekly deaths declined in NZ’s lockdown – but we still don’t know exactly why. Public Health Expert (Blog). 2020;(10 July). https://blogs.otago.ac.nz/pubhealthexpert/2020/07/10/weekly-deaths-declined-in-nzs-lockdown-but-we-still-dont-know-exactly-why/.
- Huang QS, Wood T, Jelley L, et al. Impact of the COVID-19 nonpharmaceutical interventions on influenza and other respiratory viral infections in New Zealand. medRxiv 2020.
- Greenhalgh T, Knight M, A’Court C, Buxton M, Husain L. Management of post-acute covid-19 in primary care. BMJ 2020;370:m3026.
- Every-Palmer S, Jenkins M, Gendall P, Hoek J, Beaglehole B, Bell C, Williman J, Rapsey C, Stanley J. Psychological distress, anxiety, family violence, suicidality, and wellbeing in New Zealand during the COVID-19 lockdown: A cross-sectional study. PLoS One 2020;15:e0241658.
- Nicolson MN, Flett JA. The mental wellbeing of New Zealanders during and post-lockdown. N Z Med J 2020;133:110-12.
- Boyle L, Boyle A, Jay S, Marnewick J. COVID-19 lockdown impact on common general surgical acute presentations to a regional centre in New Zealand. N Z Med J;133(1525):96-105.
- Wong B, El-Jack S, Armstrong G. Pandemic control: getting to the heart of unintended consequences. N Z Med J 2020;133:153-56.
- Nghiem N, Mizdrak A, Wilson N. Increased unemployment from the COVID-19 pandemic, what might be the adverse impacts on cardiovascular disease in Aotearoa/New Zealand and how might this be prevented? N Z Med J 2020;133(1526):89-98. https://www.nzma.org.nz/journal-articles/increased-unemployment-from-the-covid-19-pandemic-what-might-be-the-adverse-impacts-on-cardiovascular-disease-in-aotearoa-new-zealand-and-how-might-this-be-prevented
- Hale T, Webster S, Petherick A, Phillips T, Kira B. Oxford COVID-19 Government Response Tracker. Blavatnik School of Government. 2020;https://covidtracker.bsg.ox.ac.uk/.
- Statistics New Zealand. Economic data: Consumer confidence (ANZ-Roy Morgan consumer confidence): October 2020. https://www.stats.govt.nz/experimental/covid-19-data-portal.
- Pullar-Strecker T. ASB picks OCR to stay put until 2023, as Westpac trims its forecast cut. Stuff 2020;(2 December). https://www.stuff.co.nz/business/123564536/asb-picks-ocr-to-stay-put-until-2023-as-westpac-trims-its-forecast-cut.
- Taiwan CDC. COVID-19 (2019-nCoV). https://sites.google.com/cdc.gov.tw/2019-ncov/taiwan.
- Summers J, Lin H-H, Cheng H-Y, Telfar Barnard L, Kvalsvig A, Wilson N, Baker M. Potential lessons from the Taiwan and New Zealand health responses to the COVID-19 pandemic. Lancet Regional Health Western Pacific 2020;https://doi.org/10.1016/j.lanwpc.2020.100044.
- Wilson N, Grout L, Kvalsvig A, Baker M. Time to Stop Dodging Bullets? NZ’s Eight Recent Border Control Failures. Public Health Expert (Blog) 2020;(16 November). https://blogs.otago.ac.nz/pubhealthexpert/2020/11/16/time-to-stop-dodging-bullets-nzs-eight-recent-border-control-failures/.
- Cheng D. Covid 19 coronavirus: Chafing under the rules – 76 bubble breaches in four months. N Z Herald 2020;(28 November). https://www.nzherald.co.nz/nz/covid-19-coronavirus-chafing-under-the-rules-76-bubble-breaches-in-four-months/5WLODXO7S4SBCZY7UWBWKSZOUI/.
- Wilson N, Baker M. New Zealand needs a ‘traffic light’ system to stop COVID-19 creeping in at the border. The Conversation 2020;(4 November). https://theconversation.com/new-zealand-needs-a-traffic-light-system-to-stop-covid-19-creeping-in-at-the-border-149262.
- Lowrey A. America Failed at COVID-19, but the Economy’s Okay. Why? The Atlantic 2020;(27 November). https://www.theatlantic.com/ideas/archive/2020/11/america-failed-covid-economys-ok-why/617223/?utm_source=pocket-newtab-intl-en.
- Boyd M, Baker MG, Nelson C, Wilson N. The 2019 Global Health Security Index (GHSI) and its implications for New Zealand and Pacific regional health security. N Z Med J 2020;133:83-92.
- Scudellari M. How Iceland hammered COVID with science. Nature 2020;587:536-39.
- Gray B. Bioethicists, Scientists and Politicians; Decision Making in a Pandemic. Public Health Expert (Blog) 2020;(1 December). https://blogs.otago.ac.nz/pubhealthexpert/2020/12/01/bioethicists-scientists-and-politicians-decision-making-in-a-pandemic/.
- Wilson N, Telfar Barnard L, Summers J, Shanks G, Baker M. Differential mortality by ethnicity in 3 influenza pandemics over a century, New Zealand. Emerg Infect Dis 2012;18:71-77.
- Wilson N, Mansoor O, Baker M. The first analytic evidence for socio-economic gradients in 1918 pandemic influenza mortality rates for New Zealand. N Z Med J 2018 131(1486):50-53.
Where did the 16 life years per death come from? I read the article in the footnote and it mentioned nothing like that figure. Additionally, I think the figures overlook that most of those who die have co-morbidities which mean that their remaining life years are in fact much less than the average for others of the same age.
Thanks for this incisive feedback. An upper limit of life expectancy loss per death from COVID-19 was mistakenly used in this life-years lost calculation in the initial blog and so this has been corrected in the above blog to now give both the central estimate and the full range of potential life-years lost as calculated from the estimates of Merois et al for North America and Europe (see dot points below).
• Estimated life expectancy lost (years) in the population if 70% prevalence of infection (from Table S1 for North America and Europe, Merois et al, Reference 8): Central estimate 6.46 (credible limits: 4.11 to 10.85)
• Estimated life expectancy lost (years) in those dying from infection (ie, a 100%/70% adjustment to the estimates in the above dot point): Central estimate 9.23 (credible limits: 5.87 to 15.50)
• Estimated total life-years lost for 2000 deaths (the OECD average [excluding NZ] as per 22 November for a population the size of NZ): Central estimate 18,000 (credible limits: 12,000 to 31,000)
It is also correct that these life-years lost estimates may be over-estimates if accounting for co-morbidity (eg, people with co-morbid chronic conditions typically have lower life expectancy) and also if the case fatality risk differentially declines in younger people with treatment improvements. But they will be under-estimates if there are times when a health system gets overloaded and treatment quality declines for all age-groups. Ultimately such life-years lost estimates will need to be redone when the pandemic is over and with appropriate age-structure adjustments. That will also be a time to properly account for the economic impacts as well.